
 Yahoo Finance
 A Sliding Share Price Has Us Looking At Sterling Bancorp's (NYSE:STL) P/E Ratio

Unfortunately for some shareholders, the Sterling Bancorp (NYSE:STL) share price has dived 62% in the last thirty days. That drop has capped off a tough year for shareholders, with the share price down 59% in that time.
Assuming nothing else has changed, a lower share price makes a stock more attractive to potential buyers. In the long term, share prices tend to follow earnings per share, but in the short term prices bounce around in response to short term factors (which are not always obvious). The implication here is that long term investors have an opportunity when expectations of a company are too low. Perhaps the simplest way to get a read on investors' expectations of a business is to look at its Price to Earnings Ratio (PE Ratio). A high P/E implies that investors have high expectations of what a company can achieve compared to a company with a low P/E ratio.
Check out our latest analysis for Sterling Bancorp
How Does Sterling Bancorp's P/E Ratio Compare To Its Peers?
Sterling Bancorp's P/E of 3.67 indicates relatively low sentiment towards the stock. The image below shows that Sterling Bancorp has a lower P/E than the average (8.3) P/E for companies in the banks industry.
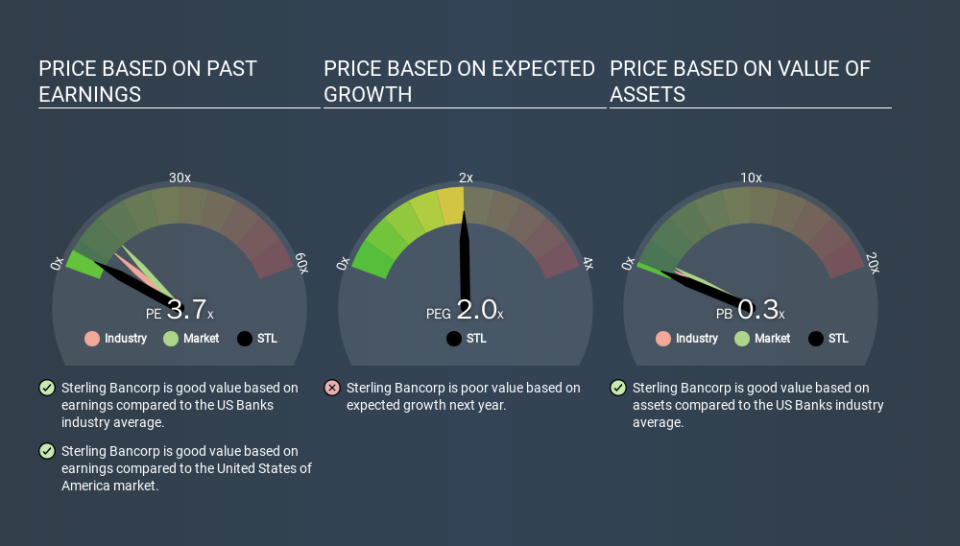
This suggests that market participants think Sterling Bancorp will underperform other companies in its industry. While current expectations are low, the stock could be undervalued if the situation is better than the market assumes. It is arguably worth checking if insiders are buying shares, because that might imply they believe the stock is undervalued.
How Growth Rates Impact P/E Ratios
Probably the most important factor in determining what P/E a company trades on is the earnings growth. Earnings growth means that in the future the 'E' will be higher. And in that case, the P/E ratio itself will drop rather quickly. And as that P/E ratio drops, the company will look cheap, unless its share price increases.
Sterling Bancorp increased earnings per share by 4.0% last year. And its annual EPS growth rate over 5 years is 23%.
Don't Forget: The P/E Does Not Account For Debt or Bank Deposits
Don't forget that the P/E ratio considers market capitalization. That means it doesn't take debt or cash into account. Hypothetically, a company could reduce its future P/E ratio by spending its cash (or taking on debt) to achieve higher earnings.
Such spending might be good or bad, overall, but the key point here is that you need to look at debt to understand the P/E ratio in context.
Is Debt Impacting Sterling Bancorp's P/E?
Net debt totals a substantial 158% of Sterling Bancorp's market cap. If you want to compare its P/E ratio to other companies, you must keep in mind that these debt levels would usually warrant a relatively low P/E.
The Verdict On Sterling Bancorp's P/E Ratio
Sterling Bancorp has a P/E of 3.7. That's below the average in the US market, which is 11.5. The meaningful debt load is probably contributing to low expectations, even though it has improved earnings recently. What can be absolutely certain is that the market has become more pessimistic about Sterling Bancorp over the last month, with the P/E ratio falling from 9.6 back then to 3.7 today. For those who prefer invest in growth, this stock apparently offers limited promise, but the deep value investors may find the pessimism around this stock enticing.
Investors have an opportunity when market expectations about a stock are wrong. As value investor Benjamin Graham famously said, 'In the short run, the market is a voting machine but in the long run, it is a weighing machine. So this free report on the analyst consensus forecasts could help you make a master move on this stock.
You might be able to find a better buy than Sterling Bancorp. If you want a selection of possible winners, check out this free list of interesting companies that trade on a P/E below 20 (but have proven they can grow earnings).
If you spot an error that warrants correction, please contact the editor at editorial-team@simplywallst.com. This article by Simply Wall St is general in nature. It does not constitute a recommendation to buy or sell any stock, and does not take account of your objectives, or your financial situation. Simply Wall St has no position in the stocks mentioned.
We aim to bring you long-term focused research analysis driven by fundamental data. Note that our analysis may not factor in the latest price-sensitive company announcements or qualitative material. Thank you for reading.
