
 Yahoo Finance
 A Sliding Share Price Has Us Looking At Shoe Carnival, Inc.'s (NASDAQ:SCVL) P/E Ratio

Unfortunately for some shareholders, the Shoe Carnival (NASDAQ:SCVL) share price has dived 35% in the last thirty days. That drop has capped off a tough year for shareholders, with the share price down 30% in that time.
All else being equal, a share price drop should make a stock more attractive to potential investors. In the long term, share prices tend to follow earnings per share, but in the short term prices bounce around in response to short term factors (which are not always obvious). The implication here is that long term investors have an opportunity when expectations of a company are too low. Perhaps the simplest way to get a read on investors' expectations of a business is to look at its Price to Earnings Ratio (PE Ratio). Investors have optimistic expectations of companies with higher P/E ratios, compared to companies with lower P/E ratios.
See our latest analysis for Shoe Carnival
Does Shoe Carnival Have A Relatively High Or Low P/E For Its Industry?
Shoe Carnival's P/E of 8.19 indicates relatively low sentiment towards the stock. We can see in the image below that the average P/E (9.6) for companies in the specialty retail industry is higher than Shoe Carnival's P/E.
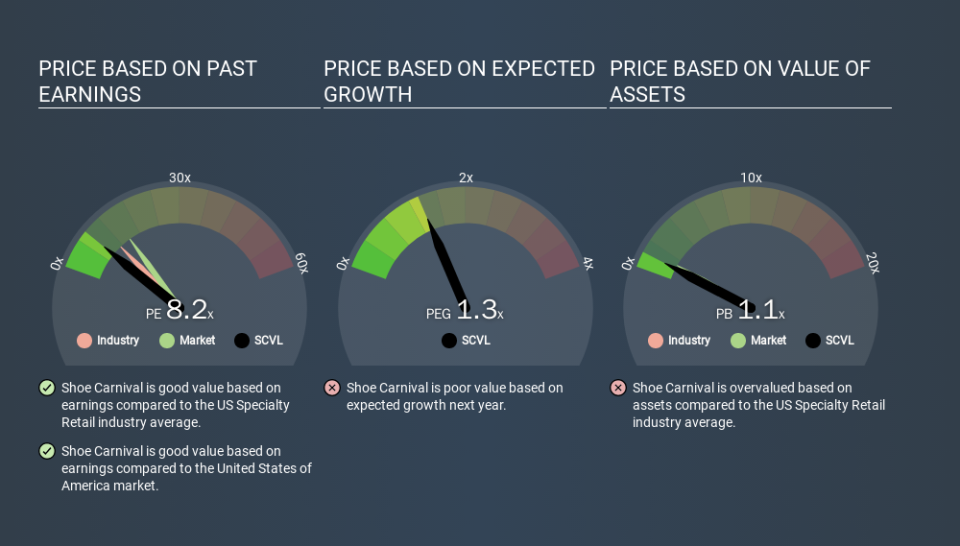
This suggests that market participants think Shoe Carnival will underperform other companies in its industry. Many investors like to buy stocks when the market is pessimistic about their prospects. If you consider the stock interesting, further research is recommended. For example, I often monitor director buying and selling.
How Growth Rates Impact P/E Ratios
P/E ratios primarily reflect market expectations around earnings growth rates. When earnings grow, the 'E' increases, over time. And in that case, the P/E ratio itself will drop rather quickly. And as that P/E ratio drops, the company will look cheap, unless its share price increases.
It's nice to see that Shoe Carnival grew EPS by a stonking 32% in the last year. And its annual EPS growth rate over 5 years is 20%. With that performance, I would expect it to have an above average P/E ratio.
Don't Forget: The P/E Does Not Account For Debt or Bank Deposits
Don't forget that the P/E ratio considers market capitalization. In other words, it does not consider any debt or cash that the company may have on the balance sheet. Theoretically, a business can improve its earnings (and produce a lower P/E in the future) by investing in growth. That means taking on debt (or spending its cash).
Spending on growth might be good or bad a few years later, but the point is that the P/E ratio does not account for the option (or lack thereof).
Shoe Carnival's Balance Sheet
Shoe Carnival has net cash of US$34m. This is fairly high at 10% of its market capitalization. That might mean balance sheet strength is important to the business, but should also help push the P/E a bit higher than it would otherwise be.
The Verdict On Shoe Carnival's P/E Ratio
Shoe Carnival trades on a P/E ratio of 8.2, which is below the US market average of 13.3. Not only should the net cash position reduce risk, but the recent growth has been impressive. One might conclude that the market is a bit pessimistic, given the low P/E ratio. Given Shoe Carnival's P/E ratio has declined from 12.7 to 8.2 in the last month, we know for sure that the market is more worried about the business today, than it was back then. For those who prefer invest in growth, this stock apparently offers limited promise, but the deep value investors may find the pessimism around this stock enticing.
Investors should be looking to buy stocks that the market is wrong about. As value investor Benjamin Graham famously said, 'In the short run, the market is a voting machine but in the long run, it is a weighing machine. So this free visualization of the analyst consensus on future earnings could help you make the right decision about whether to buy, sell, or hold.
But note: Shoe Carnival may not be the best stock to buy. So take a peek at this free list of interesting companies with strong recent earnings growth (and a P/E ratio below 20).
If you spot an error that warrants correction, please contact the editor at editorial-team@simplywallst.com. This article by Simply Wall St is general in nature. It does not constitute a recommendation to buy or sell any stock, and does not take account of your objectives, or your financial situation. Simply Wall St has no position in the stocks mentioned.
We aim to bring you long-term focused research analysis driven by fundamental data. Note that our analysis may not factor in the latest price-sensitive company announcements or qualitative material. Thank you for reading.
