
 Yahoo Finance
 A Sliding Share Price Has Us Looking At Sensata Technologies Holding plc's (NYSE:ST) P/E Ratio
Unfortunately for some shareholders, the Sensata Technologies Holding (NYSE:ST) share price has dived 43% in the last thirty days. Indeed the recent decline has arguably caused some bitterness for shareholders who have held through the 42% drop over twelve months.
Assuming nothing else has changed, a lower share price makes a stock more attractive to potential buyers. In the long term, share prices tend to follow earnings per share, but in the short term prices bounce around in response to short term factors (which are not always obvious). So, on certain occasions, long term focussed investors try to take advantage of pessimistic expectations to buy shares at a better price. Perhaps the simplest way to get a read on investors' expectations of a business is to look at its Price to Earnings Ratio (PE Ratio). A high P/E implies that investors have high expectations of what a company can achieve compared to a company with a low P/E ratio.
Check out our latest analysis for Sensata Technologies Holding
How Does Sensata Technologies Holding's P/E Ratio Compare To Its Peers?
Sensata Technologies Holding has a P/E ratio of 15.88. As you can see below Sensata Technologies Holding has a P/E ratio that is fairly close for the average for the electrical industry, which is 14.8.
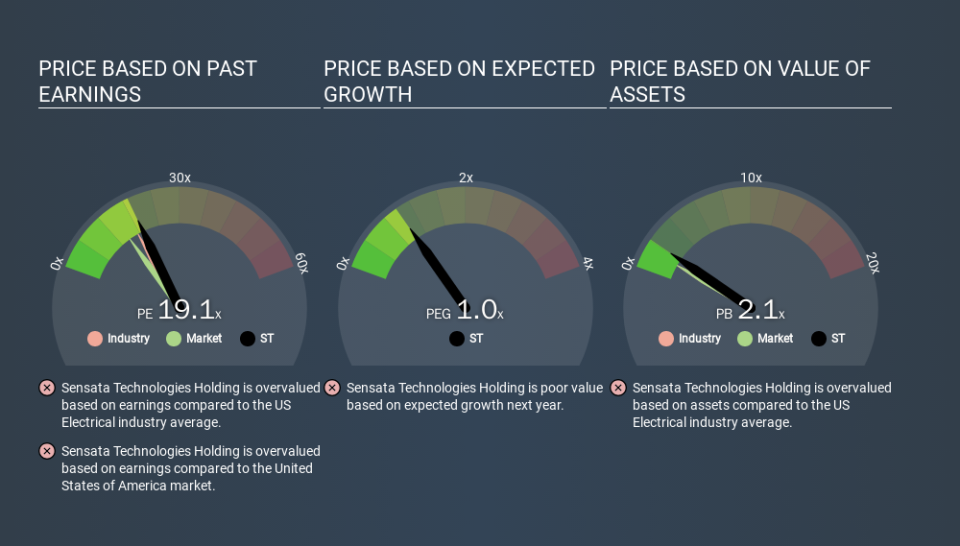
Its P/E ratio suggests that Sensata Technologies Holding shareholders think that in the future it will perform about the same as other companies in its industry classification. If the company has better than average prospects, then the market might be underestimating it. I would further inform my view by checking insider buying and selling., among other things.
How Growth Rates Impact P/E Ratios
Earnings growth rates have a big influence on P/E ratios. When earnings grow, the 'E' increases, over time. That means unless the share price increases, the P/E will reduce in a few years. Then, a lower P/E should attract more buyers, pushing the share price up.
Sensata Technologies Holding shrunk earnings per share by 51% over the last year. But over the longer term (5 years) earnings per share have increased by 1.0%.
Remember: P/E Ratios Don't Consider The Balance Sheet
The 'Price' in P/E reflects the market capitalization of the company. That means it doesn't take debt or cash into account. The exact same company would hypothetically deserve a higher P/E ratio if it had a strong balance sheet, than if it had a weak one with lots of debt, because a cashed up company can spend on growth.
Such spending might be good or bad, overall, but the key point here is that you need to look at debt to understand the P/E ratio in context.
So What Does Sensata Technologies Holding's Balance Sheet Tell Us?
Net debt totals 56% of Sensata Technologies Holding's market cap. This is enough debt that you'd have to make some adjustments before using the P/E ratio to compare it to a company with net cash.
The Bottom Line On Sensata Technologies Holding's P/E Ratio
Sensata Technologies Holding's P/E is 15.9 which is above average (12.7) in its market. With meaningful debt and a lack of recent earnings growth, the market has high expectations that the business will earn more in the future. What can be absolutely certain is that the market has become significantly less optimistic about Sensata Technologies Holding over the last month, with the P/E ratio falling from 27.8 back then to 15.9 today. For those who don't like to trade against momentum, that could be a warning sign, but a contrarian investor might want to take a closer look.
Investors should be looking to buy stocks that the market is wrong about. As value investor Benjamin Graham famously said, 'In the short run, the market is a voting machine but in the long run, it is a weighing machine. So this free visualization of the analyst consensus on future earnings could help you make the right decision about whether to buy, sell, or hold.
Of course, you might find a fantastic investment by looking at a few good candidates. So take a peek at this free list of companies with modest (or no) debt, trading on a P/E below 20.
If you spot an error that warrants correction, please contact the editor at editorial-team@simplywallst.com. This article by Simply Wall St is general in nature. It does not constitute a recommendation to buy or sell any stock, and does not take account of your objectives, or your financial situation. Simply Wall St has no position in the stocks mentioned.
We aim to bring you long-term focused research analysis driven by fundamental data. Note that our analysis may not factor in the latest price-sensitive company announcements or qualitative material. Thank you for reading.
