
 Yahoo Finance
 A Sliding Share Price Has Us Looking At OSI Systems, Inc.'s (NASDAQ:OSIS) P/E Ratio

To the annoyance of some shareholders, OSI Systems (NASDAQ:OSIS) shares are down a considerable 30% in the last month. The recent drop has obliterated the annual return, with the share price now down 28% over that longer period.
All else being equal, a share price drop should make a stock more attractive to potential investors. While the market sentiment towards a stock is very changeable, in the long run, the share price will tend to move in the same direction as earnings per share. So, on certain occasions, long term focussed investors try to take advantage of pessimistic expectations to buy shares at a better price. Perhaps the simplest way to get a read on investors' expectations of a business is to look at its Price to Earnings Ratio (PE Ratio). A high P/E implies that investors have high expectations of what a company can achieve compared to a company with a low P/E ratio.
View our latest analysis for OSI Systems
Does OSI Systems Have A Relatively High Or Low P/E For Its Industry?
OSI Systems's P/E of 14.52 indicates some degree of optimism towards the stock. As you can see below, OSI Systems has a higher P/E than the average company (12.9) in the electronic industry.
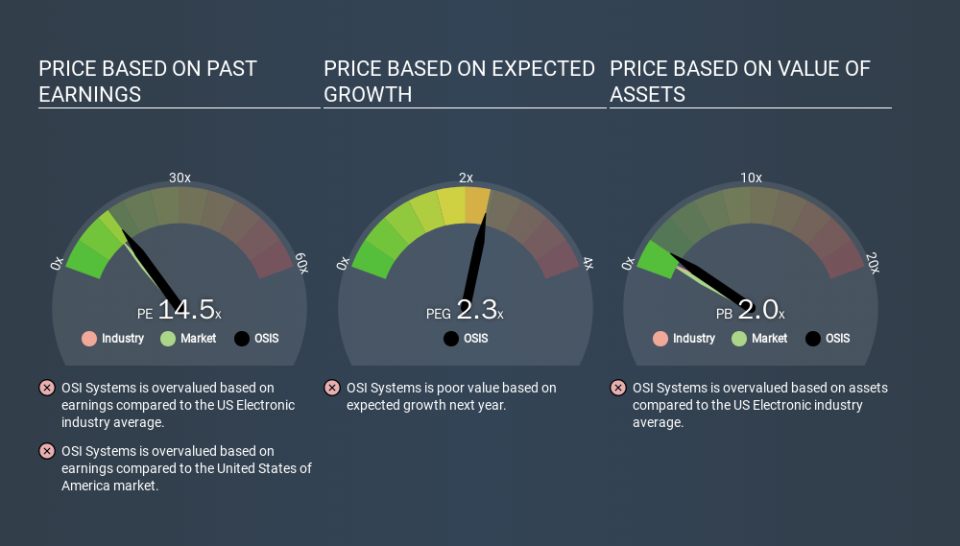
That means that the market expects OSI Systems will outperform other companies in its industry. Clearly the market expects growth, but it isn't guaranteed. So further research is always essential. I often monitor director buying and selling.
How Growth Rates Impact P/E Ratios
Earnings growth rates have a big influence on P/E ratios. If earnings are growing quickly, then the 'E' in the equation will increase faster than it would otherwise. That means unless the share price increases, the P/E will reduce in a few years. So while a stock may look expensive based on past earnings, it could be cheap based on future earnings.
OSI Systems's 116% EPS improvement over the last year was like bamboo growth after rain; rapid and impressive. Even better, EPS is up 58% per year over three years. So you might say it really deserves to have an above-average P/E ratio.
Don't Forget: The P/E Does Not Account For Debt or Bank Deposits
The 'Price' in P/E reflects the market capitalization of the company. So it won't reflect the advantage of cash, or disadvantage of debt. Theoretically, a business can improve its earnings (and produce a lower P/E in the future) by investing in growth. That means taking on debt (or spending its cash).
Such spending might be good or bad, overall, but the key point here is that you need to look at debt to understand the P/E ratio in context.
How Does OSI Systems's Debt Impact Its P/E Ratio?
OSI Systems's net debt is 23% of its market cap. This could bring some additional risk, and reduce the number of investment options for management; worth remembering if you compare its P/E to businesses without debt.
The Bottom Line On OSI Systems's P/E Ratio
OSI Systems's P/E is 14.5 which is above average (12.8) in its market. Its debt levels do not imperil its balance sheet and its EPS growth is very healthy indeed. So to be frank we are not surprised it has a high P/E ratio. What can be absolutely certain is that the market has become significantly less optimistic about OSI Systems over the last month, with the P/E ratio falling from 20.8 back then to 14.5 today. For those who prefer to invest with the flow of momentum, that might be a bad sign, but for a contrarian, it may signal opportunity.
Investors have an opportunity when market expectations about a stock are wrong. If the reality for a company is better than it expects, you can make money by buying and holding for the long term. So this free visualization of the analyst consensus on future earnings could help you make the right decision about whether to buy, sell, or hold.
Of course, you might find a fantastic investment by looking at a few good candidates. So take a peek at this free list of companies with modest (or no) debt, trading on a P/E below 20.
If you spot an error that warrants correction, please contact the editor at editorial-team@simplywallst.com. This article by Simply Wall St is general in nature. It does not constitute a recommendation to buy or sell any stock, and does not take account of your objectives, or your financial situation. Simply Wall St has no position in the stocks mentioned.
We aim to bring you long-term focused research analysis driven by fundamental data. Note that our analysis may not factor in the latest price-sensitive company announcements or qualitative material. Thank you for reading.
