
 Yahoo Finance
 A Sliding Share Price Has Us Looking At Global Payments Inc.'s (NYSE:GPN) P/E Ratio

Unfortunately for some shareholders, the Global Payments (NYSE:GPN) share price has dived 35% in the last thirty days. Zooming out, the recent drop wiped out a year's worth of gains, with the share price now back where it was a year ago.
All else being equal, a share price drop should make a stock more attractive to potential investors. In the long term, share prices tend to follow earnings per share, but in the short term prices bounce around in response to short term factors (which are not always obvious). So, on certain occasions, long term focussed investors try to take advantage of pessimistic expectations to buy shares at a better price. Perhaps the simplest way to get a read on investors' expectations of a business is to look at its Price to Earnings Ratio (PE Ratio). A high P/E implies that investors have high expectations of what a company can achieve compared to a company with a low P/E ratio.
View our latest analysis for Global Payments
How Does Global Payments's P/E Ratio Compare To Its Peers?
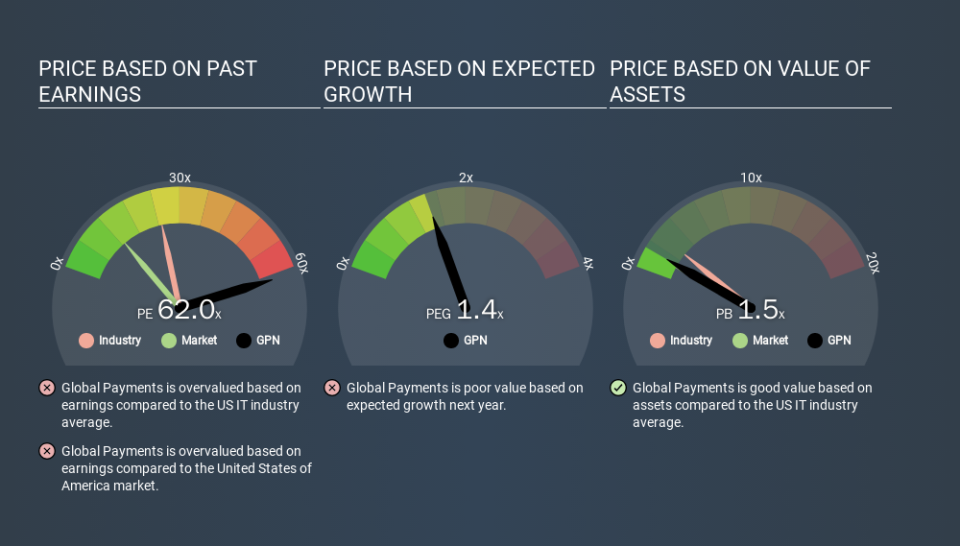
Global Payments's P/E of 61.97 indicates some degree of optimism towards the stock. As you can see below, Global Payments has a higher P/E than the average company (22.0) in the it industry.
Global Payments's P/E tells us that market participants think the company will perform better than its industry peers, going forward. The market is optimistic about the future, but that doesn't guarantee future growth. So investors should delve deeper. I like to check if company insiders have been buying or selling.
How Growth Rates Impact P/E Ratios
Earnings growth rates have a big influence on P/E ratios. When earnings grow, the 'E' increases, over time. And in that case, the P/E ratio itself will drop rather quickly. A lower P/E should indicate the stock is cheap relative to others -- and that may attract buyers.
Global Payments's earnings per share fell by 24% in the last twelve months. But over the longer term (5 years) earnings per share have increased by 3.3%.
Don't Forget: The P/E Does Not Account For Debt or Bank Deposits
The 'Price' in P/E reflects the market capitalization of the company. That means it doesn't take debt or cash into account. Theoretically, a business can improve its earnings (and produce a lower P/E in the future) by investing in growth. That means taking on debt (or spending its cash).
Such expenditure might be good or bad, in the long term, but the point here is that the balance sheet is not reflected by this ratio.
Global Payments's Balance Sheet
Global Payments's net debt is 20% of its market cap. This could bring some additional risk, and reduce the number of investment options for management; worth remembering if you compare its P/E to businesses without debt.
The Bottom Line On Global Payments's P/E Ratio
With a P/E ratio of 62.0, Global Payments is expected to grow earnings very strongly in the years to come. With modest debt but no EPS growth in the last year, it's fair to say the P/E implies some optimism about future earnings, from the market. What can be absolutely certain is that the market has become significantly less optimistic about Global Payments over the last month, with the P/E ratio falling from 95.4 back then to 62.0 today. For those who don't like to trade against momentum, that could be a warning sign, but a contrarian investor might want to take a closer look.
When the market is wrong about a stock, it gives savvy investors an opportunity. As value investor Benjamin Graham famously said, 'In the short run, the market is a voting machine but in the long run, it is a weighing machine. So this free report on the analyst consensus forecasts could help you make a master move on this stock.
You might be able to find a better buy than Global Payments. If you want a selection of possible winners, check out this free list of interesting companies that trade on a P/E below 20 (but have proven they can grow earnings).
If you spot an error that warrants correction, please contact the editor at editorial-team@simplywallst.com. This article by Simply Wall St is general in nature. It does not constitute a recommendation to buy or sell any stock, and does not take account of your objectives, or your financial situation. Simply Wall St has no position in the stocks mentioned.
We aim to bring you long-term focused research analysis driven by fundamental data. Note that our analysis may not factor in the latest price-sensitive company announcements or qualitative material. Thank you for reading.
