
 Yahoo Finance
 SL Green's (SLG) FFO and Revenues Surpass Estimates in Q1

SL Green Realty Corp. SLG reported first-quarter 2023 funds from operations (FFO) per share of $1.53, surpassing the Zacks Consensus Estimate of $1.42. The figure, however, fell 7.3% from the year-ago quarter’s $1.65.
The results reflect better-than-anticipated revenues. However, a fall in occupancy in Manhattan’s same-store office portfolio was a deterrent for the company in the reported quarter.
SLG clocked in net rental revenues of $174.6 million in the first quarter, which beat the Zacks Consensus Estimate of $159.5 million. Moreover, on a year-over-year basis, the net rental revenues climbed 27.9% from the prior-year quarter’s $136.5 million.
Quarter in Detail
During the first quarter, the same-store NOI, including SL Green’s share of same-store cash NOI from unconsolidated joint ventures, increased 5.3% year over year to $155.6 million. This excludes the lease termination income.
For its Manhattan portfolio, SL Green signed 41 office leases encompassing 504,682 square feet of space in the reported quarter. The mark-to-market on signed Manhattan office leases increased 5.3% from the previous fully-escalated rents on the same spaces for the quarter.
The average lease term for the Manhattan office leases signed was 6.3 years, while average tenant concessions were 4.8 months of free rent with a tenant improvement allowance of $42.71 per rentable square foot. This excludes the leases signed at One Vanderbilt Avenue and One Madison Avenue.
As of Mar 31, 2023, Manhattan’s same-store office occupancy, inclusive of 290,491 square feet of leases signed but not yet commenced, was 90.2%, down from 92% at the end of the prior quarter and 93% at the end of the year-ago quarter.
As of the same date, the carrying value of the company’s debt and preferred equity portfolio was $626.8 million.
Liquidity
SL Green exited first-quarter 2023 with cash and cash equivalents of $158.9 million, down from $203.3 million recorded as of Dec 31, 2022.
Investment Activity
In February, SLG, together with its joint venture partner, completed the earlier announced disposition of the retail condominiums at 121 Greene Street for $14 million.
SL Green currently carries a Zacks Rank #3 (Hold). You can see the complete list of today’s Zacks #1 Rank (Strong Buy) stocks here.
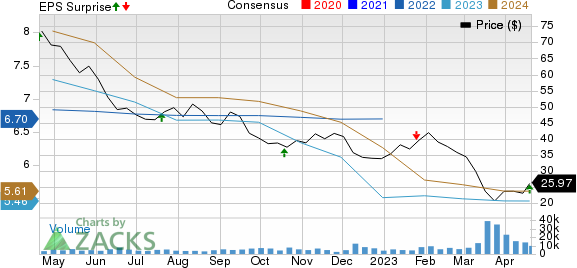
SL Green Realty Corporation Price, Consensus and EPS Surprise
SL Green Realty Corporation price-consensus-eps-surprise-chart | SL Green Realty Corporation Quote
Upcoming Earnings Releases
We now look forward to the earnings releases of other REITs like Alexandria Real Estate Equities, Inc. ARE and Boston Properties BXP, slated to report on Apr 24 and Apr 25, respectively. Equinix EQIX is scheduled on May 3.
The Zacks Consensus Estimate for Alexandria’s first-quarter 2023 FFO per share is pegged at $2.15, implying a year-over-year increase of 4.9%. ARE currently carries a Zacks Rank #3.
The Zacks Consensus Estimate for Boston Properties’ quarterly FFO per share stands at $1.70, indicating a year-over-year fall of 6.6%. BXP currently has a Zacks Rank #3.
The Zacks Consensus Estimate for Equinix’s first-quarter 2023 FFO per share is pegged at $7.88, suggesting a year-over-year increase of 10.1%. EQIX currently carries a Zacks Rank #2 (Buy).
Note: Anything related to earnings presented in this write-up represents FFO — a widely used metric to gauge the performance of REITs.
Want the latest recommendations from Zacks Investment Research? Today, you can download 7 Best Stocks for the Next 30 Days. Click to get this free report
Equinix, Inc. (EQIX) : Free Stock Analysis Report
Boston Properties, Inc. (BXP) : Free Stock Analysis Report
SL Green Realty Corporation (SLG) : Free Stock Analysis Report
Alexandria Real Estate Equities, Inc. (ARE) : Free Stock Analysis Report
