
 Yahoo Finance
 SiTime (NASDAQ:SITM) Will Want To Turn Around Its Return Trends
If you're not sure where to start when looking for the next multi-bagger, there are a few key trends you should keep an eye out for. Firstly, we'd want to identify a growing return on capital employed (ROCE) and then alongside that, an ever-increasing base of capital employed. Ultimately, this demonstrates that it's a business that is reinvesting profits at increasing rates of return. However, after briefly looking over the numbers, we don't think SiTime (NASDAQ:SITM) has the makings of a multi-bagger going forward, but let's have a look at why that may be.
Return On Capital Employed (ROCE): What Is It?
For those that aren't sure what ROCE is, it measures the amount of pre-tax profits a company can generate from the capital employed in its business. The formula for this calculation on SiTime is:
Return on Capital Employed = Earnings Before Interest and Tax (EBIT) ÷ (Total Assets - Current Liabilities)
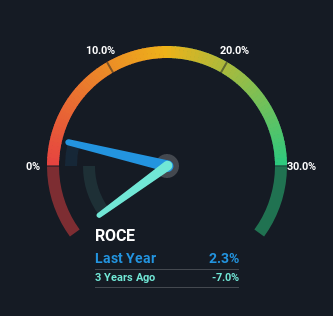
0.023 = US$16m ÷ (US$751m - US$34m) (Based on the trailing twelve months to December 2022).
Thus, SiTime has an ROCE of 2.3%. In absolute terms, that's a low return and it also under-performs the Semiconductor industry average of 15%.
Check out our latest analysis for SiTime
Above you can see how the current ROCE for SiTime compares to its prior returns on capital, but there's only so much you can tell from the past. If you'd like to see what analysts are forecasting going forward, you should check out our free report for SiTime.
So How Is SiTime's ROCE Trending?
In terms of SiTime's historical ROCE movements, the trend isn't fantastic. Around five years ago the returns on capital were 28%, but since then they've fallen to 2.3%. Although, given both revenue and the amount of assets employed in the business have increased, it could suggest the company is investing in growth, and the extra capital has led to a short-term reduction in ROCE. If these investments prove successful, this can bode very well for long term stock performance.
On a side note, SiTime has done well to pay down its current liabilities to 4.5% of total assets. Since the ratio used to be 73%, that's a significant reduction and it no doubt explains the drop in ROCE. Effectively this means their suppliers or short-term creditors are funding less of the business, which reduces some elements of risk. Some would claim this reduces the business' efficiency at generating ROCE since it is now funding more of the operations with its own money.
The Bottom Line On SiTime's ROCE
While returns have fallen for SiTime in recent times, we're encouraged to see that sales are growing and that the business is reinvesting in its operations. And the stock has done incredibly well with a 325% return over the last three years, so long term investors are no doubt ecstatic with that result. So while investors seem to be recognizing these promising trends, we would look further into this stock to make sure the other metrics justify the positive view.
On a separate note, we've found 3 warning signs for SiTime you'll probably want to know about.
If you want to search for solid companies with great earnings, check out this free list of companies with good balance sheets and impressive returns on equity.
Have feedback on this article? Concerned about the content? Get in touch with us directly. Alternatively, email editorial-team (at) simplywallst.com.
This article by Simply Wall St is general in nature. We provide commentary based on historical data and analyst forecasts only using an unbiased methodology and our articles are not intended to be financial advice. It does not constitute a recommendation to buy or sell any stock, and does not take account of your objectives, or your financial situation. We aim to bring you long-term focused analysis driven by fundamental data. Note that our analysis may not factor in the latest price-sensitive company announcements or qualitative material. Simply Wall St has no position in any stocks mentioned.
Join A Paid User Research Session
You’ll receive a US$30 Amazon Gift card for 1 hour of your time while helping us build better investing tools for the individual investors like yourself. Sign up here
