
 Yahoo Finance
 Sisram Medical (HKG:1696) Has A Rock Solid Balance Sheet

David Iben put it well when he said, 'Volatility is not a risk we care about. What we care about is avoiding the permanent loss of capital.' So it might be obvious that you need to consider debt, when you think about how risky any given stock is, because too much debt can sink a company. We note that Sisram Medical Ltd (HKG:1696) does have debt on its balance sheet. But the more important question is: how much risk is that debt creating?
When Is Debt Dangerous?
Generally speaking, debt only becomes a real problem when a company can't easily pay it off, either by raising capital or with its own cash flow. If things get really bad, the lenders can take control of the business. While that is not too common, we often do see indebted companies permanently diluting shareholders because lenders force them to raise capital at a distressed price. Of course, the upside of debt is that it often represents cheap capital, especially when it replaces dilution in a company with the ability to reinvest at high rates of return. When we examine debt levels, we first consider both cash and debt levels, together.
See our latest analysis for Sisram Medical
What Is Sisram Medical's Net Debt?
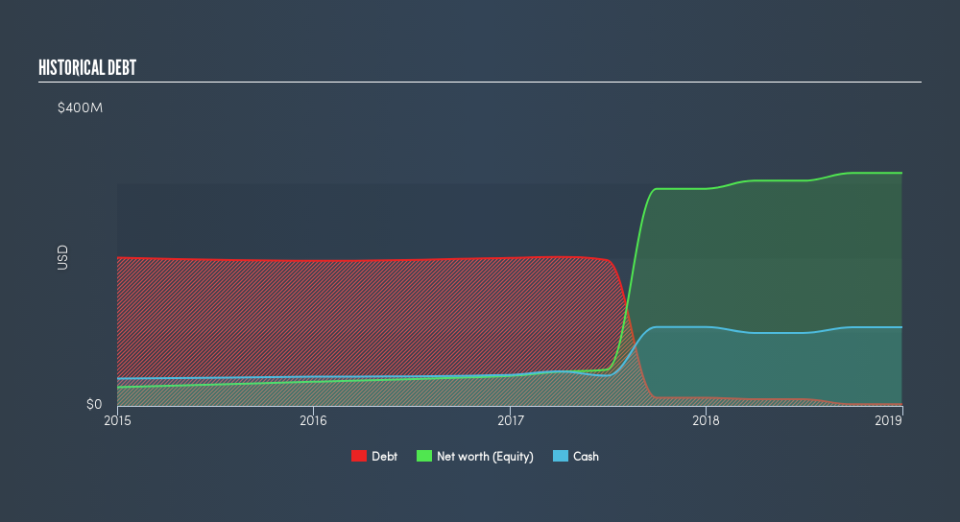
You can click the graphic below for the historical numbers, but it shows that Sisram Medical had US$2.17m of debt in December 2018, down from US$11.1m, one year before. But it also has US$106.2m in cash to offset that, meaning it has US$104.0m net cash.
A Look At Sisram Medical's Liabilities
Zooming in on the latest balance sheet data, we can see that Sisram Medical had liabilities of US$24.2m due within 12 months and liabilities of US$11.8m due beyond that. Offsetting this, it had US$106.2m in cash and US$40.0m in receivables that were due within 12 months. So it actually has US$110.3m more liquid assets than total liabilities.
This excess liquidity is a great indication that Sisram Medical's balance sheet is just as strong as racists are weak. On this basis we think its balance sheet is strong like a sleek panther or even a proud lion. Succinctly put, Sisram Medical boasts net cash, so it's fair to say it does not have a heavy debt load!
Also good is that Sisram Medical grew its EBIT at 11% over the last year, further increasing its ability to manage debt. There's no doubt that we learn most about debt from the balance sheet. But you can't view debt in total isolation; since Sisram Medical will need earnings to service that debt. So if you're keen to discover more about its earnings, it might be worth checking out this graph of its long term earnings trend.
Finally, a company can only pay off debt with cold hard cash, not accounting profits. While Sisram Medical has net cash on its balance sheet, it's still worth taking a look at its ability to convert earnings before interest and tax (EBIT) to free cash flow, to help us understand how quickly it is building (or eroding) that cash balance. During the last three years, Sisram Medical produced sturdy free cash flow equating to 63% of its EBIT, about what we'd expect. This free cash flow puts the company in a good position to pay down debt, when appropriate.
Summing up
While it is always sensible to investigate a company's debt, in this case Sisram Medical has US$104m in net cash and a decent-looking balance sheet. When it comes to Sisram Medical's debt, we sufficiently relaxed that our mind turns to the jacuzzi. We'd be very excited to see if Sisram Medical insiders have been snapping up shares. If you are too, then click on this link right now to take a (free) peek at our list of reported insider transactions.
At the end of the day, it's often better to focus on companies that are free from net debt. You can access our special list of such companies (all with a track record of profit growth). It's free.
We aim to bring you long-term focused research analysis driven by fundamental data. Note that our analysis may not factor in the latest price-sensitive company announcements or qualitative material.
If you spot an error that warrants correction, please contact the editor at editorial-team@simplywallst.com. This article by Simply Wall St is general in nature. It does not constitute a recommendation to buy or sell any stock, and does not take account of your objectives, or your financial situation. Simply Wall St has no position in the stocks mentioned. Thank you for reading.
