
 Yahoo Finance
 Update: Simonds Group (ASX:SIO) Stock Gained 96% In The Last Five Years
Generally speaking the aim of active stock picking is to find companies that provide returns that are superior to the market average. And in our experience, buying the right stocks can give your wealth a significant boost. To wit, the Simonds Group share price has climbed 96% in five years, easily topping the market return of 34% (ignoring dividends). On the other hand, the more recent gains haven't been so impressive, with shareholders gaining just 66%.
Check out our latest analysis for Simonds Group
While markets are a powerful pricing mechanism, share prices reflect investor sentiment, not just underlying business performance. One flawed but reasonable way to assess how sentiment around a company has changed is to compare the earnings per share (EPS) with the share price.
Simonds Group's earnings per share are down 20% per year, despite strong share price performance over five years.
Essentially, it doesn't seem likely that investors are focused on EPS. Because earnings per share don't seem to match up with the share price, we'll take a look at other metrics instead.
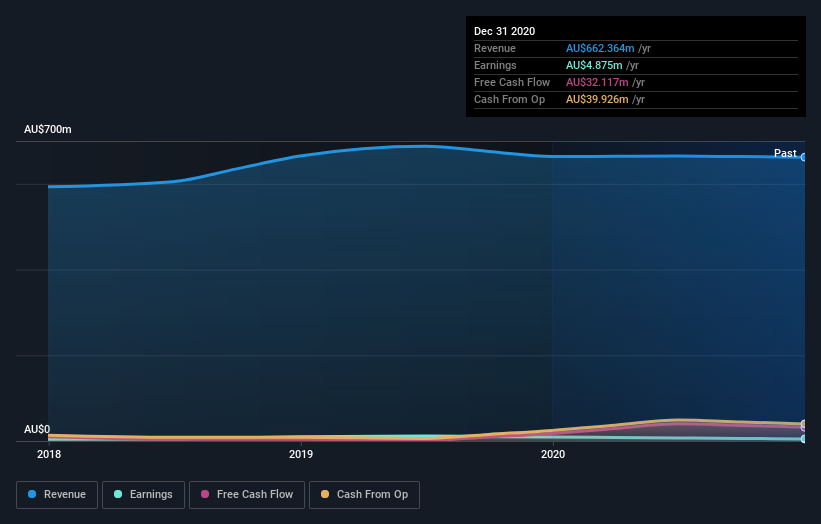
The revenue growth of 2.0% per year hardly seems impressive. So it seems one might have to take closer look at earnings and revenue trends to see how they might influence the share price.
The company's revenue and earnings (over time) are depicted in the image below (click to see the exact numbers).
We like that insiders have been buying shares in the last twelve months. Even so, future earnings will be far more important to whether current shareholders make money. Dive deeper into the earnings by checking this interactive graph of Simonds Group's earnings, revenue and cash flow.
A Different Perspective
We're pleased to report that Simonds Group shareholders have received a total shareholder return of 66% over one year. That's better than the annualised return of 14% over half a decade, implying that the company is doing better recently. Someone with an optimistic perspective could view the recent improvement in TSR as indicating that the business itself is getting better with time. It's always interesting to track share price performance over the longer term. But to understand Simonds Group better, we need to consider many other factors. To that end, you should be aware of the 2 warning signs we've spotted with Simonds Group .
Simonds Group is not the only stock insiders are buying. So take a peek at this free list of growing companies with insider buying.
Please note, the market returns quoted in this article reflect the market weighted average returns of stocks that currently trade on AU exchanges.
This article by Simply Wall St is general in nature. It does not constitute a recommendation to buy or sell any stock, and does not take account of your objectives, or your financial situation. We aim to bring you long-term focused analysis driven by fundamental data. Note that our analysis may not factor in the latest price-sensitive company announcements or qualitative material. Simply Wall St has no position in any stocks mentioned.
Have feedback on this article? Concerned about the content? Get in touch with us directly. Alternatively, email editorial-team (at) simplywallst.com.
