
 Yahoo Finance
 Silver Chef Limited (ASX:SIV): Can It Deliver A Superior ROE To The Industry?

This analysis is intended to introduce important early concepts to people who are starting to invest and want to begin learning the link between Silver Chef Limited (ASX:SIV)’s return fundamentals and stock market performance.
Silver Chef Limited’s (ASX:SIV) most recent return on equity was a substandard 1.82% relative to its industry performance of 8.09% over the past year. An investor may attribute an inferior ROE to a relatively inefficient performance, and whilst this can often be the case, knowing the nuts and bolts of the ROE calculation may change that perspective and give you a deeper insight into SIV’s past performance. Metrics such as financial leverage can impact the level of ROE which in turn can affect the sustainability of SIV’s returns. Let me show you what I mean by this. See our latest analysis for Silver Chef
What you must know about ROE
Return on Equity (ROE) is a measure of Silver Chef’s profit relative to its shareholders’ equity. It essentially shows how much the company can generate in earnings given the amount of equity it has raised. While a higher ROE is preferred in most cases, there are several other factors we should consider before drawing any conclusions.
Return on Equity = Net Profit ÷ Shareholders Equity
ROE is measured against cost of equity in order to determine the efficiency of Silver Chef’s equity capital deployed. Its cost of equity is 17.23%. Given a discrepancy of -15.40% between return and cost, this indicated that Silver Chef may be paying more for its capital than what it’s generating in return. ROE can be split up into three useful ratios: net profit margin, asset turnover, and financial leverage. This is called the Dupont Formula:
Dupont Formula
ROE = profit margin × asset turnover × financial leverage
ROE = (annual net profit ÷ sales) × (sales ÷ assets) × (assets ÷ shareholders’ equity)
ROE = annual net profit ÷ shareholders’ equity

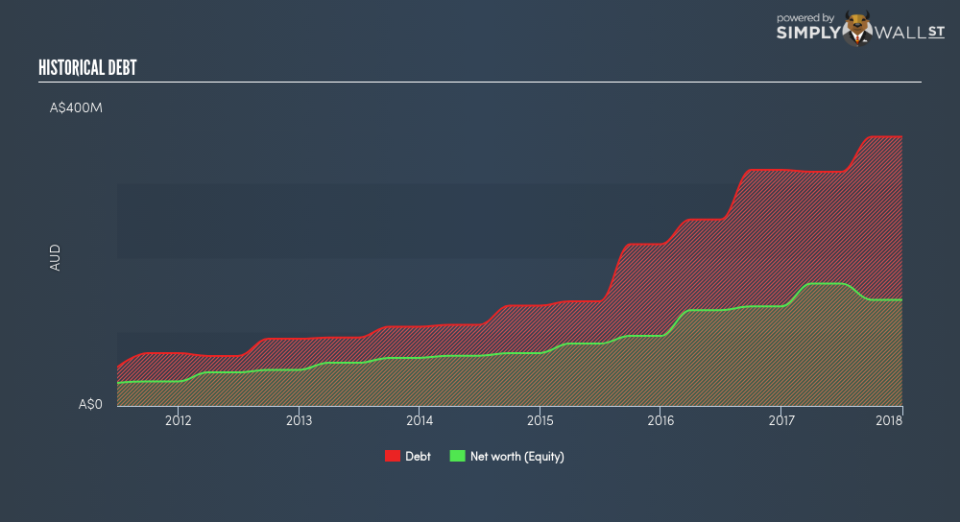
Basically, profit margin measures how much of revenue trickles down into earnings which illustrates how efficient the business is with its cost management. Asset turnover reveals how much revenue can be generated from Silver Chef’s asset base. And finally, financial leverage is simply how much of assets are funded by equity, which exhibits how sustainable the company’s capital structure is. Since ROE can be artificially increased through excessive borrowing, we should check Silver Chef’s historic debt-to-equity ratio. Currently the debt-to-equity ratio stands at more than 2.5 times, which means its below-average ROE is already being driven by significant debt levels.
Next Steps:
While ROE is a relatively simple calculation, it can be broken down into different ratios, each telling a different story about the strengths and weaknesses of a company. Silver Chef’s ROE is underwhelming relative to the industry average, and its returns were also not strong enough to cover its own cost of equity. Its concerning leverage level means its ROE is already supported by high debt, raising questions over whether ROE will further decline in the future. ROE is a helpful signal, but it is definitely not sufficient on its own to make an investment decision.
For Silver Chef, I’ve put together three important factors you should look at:
Financial Health: Does it have a healthy balance sheet? Take a look at our free balance sheet analysis with six simple checks on key factors like leverage and risk.
Management:Have insiders been ramping up their shares to take advantage of the market’s sentiment for Silver Chef’s future outlook? Check out our management and board analysis with insights on CEO compensation and governance factors.
Other High-Growth Alternatives : Are there other high-growth stocks you could be holding instead of Silver Chef? Explore our interactive list of stocks with large growth potential to get an idea of what else is out there you may be missing!
To help readers see pass the short term volatility of the financial market, we aim to bring you a long-term focused research analysis purely driven by fundamental data. Note that our analysis does not factor in the latest price sensitive company announcements.
The author is an independent contributor and at the time of publication had no position in the stocks mentioned.
