
 Yahoo Finance
 Signet Jewelers' (NYSE:SIG) three-year total shareholder returns outpace the underlying earnings growth
It hasn't been the best quarter for Signet Jewelers Limited (NYSE:SIG) shareholders, since the share price has fallen 11% in that time. But in three years the returns have been great. In three years the stock price has launched 281% higher: a great result. So the recent fall in the share price should be viewed in that context. The fundamental business performance will ultimately dictate whether the top is in, or if this is a stellar buying opportunity.
Although Signet Jewelers has shed US$232m from its market cap this week, let's take a look at its longer term fundamental trends and see if they've driven returns.
Check out our latest analysis for Signet Jewelers
In his essay The Superinvestors of Graham-and-Doddsville Warren Buffett described how share prices do not always rationally reflect the value of a business. One imperfect but simple way to consider how the market perception of a company has shifted is to compare the change in the earnings per share (EPS) with the share price movement.
Signet Jewelers was able to grow its EPS at 75% per year over three years, sending the share price higher. This EPS growth is higher than the 56% average annual increase in the share price. So it seems investors have become more cautious about the company, over time. This cautious sentiment is reflected in its (fairly low) P/E ratio of 8.47.
You can see how EPS has changed over time in the image below (click on the chart to see the exact values).
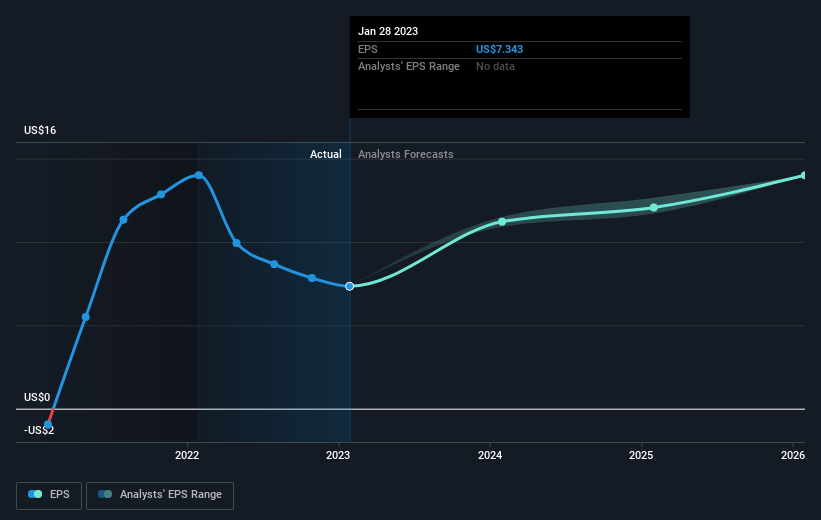
We know that Signet Jewelers has improved its bottom line over the last three years, but what does the future have in store? It might be well worthwhile taking a look at our free report on how its financial position has changed over time.
What About Dividends?
It is important to consider the total shareholder return, as well as the share price return, for any given stock. Whereas the share price return only reflects the change in the share price, the TSR includes the value of dividends (assuming they were reinvested) and the benefit of any discounted capital raising or spin-off. It's fair to say that the TSR gives a more complete picture for stocks that pay a dividend. We note that for Signet Jewelers the TSR over the last 3 years was 289%, which is better than the share price return mentioned above. And there's no prize for guessing that the dividend payments largely explain the divergence!
A Different Perspective
Signet Jewelers provided a TSR of 2.4% over the last twelve months. But that return falls short of the market. If we look back over five years, the returns are even better, coming in at 5% per year for five years. It's quite possible the business continues to execute with prowess, even as the share price gains are slowing. I find it very interesting to look at share price over the long term as a proxy for business performance. But to truly gain insight, we need to consider other information, too. To that end, you should be aware of the 3 warning signs we've spotted with Signet Jewelers .
If you would prefer to check out another company -- one with potentially superior financials -- then do not miss this free list of companies that have proven they can grow earnings.
Please note, the market returns quoted in this article reflect the market weighted average returns of stocks that currently trade on American exchanges.
Have feedback on this article? Concerned about the content? Get in touch with us directly. Alternatively, email editorial-team (at) simplywallst.com.
This article by Simply Wall St is general in nature. We provide commentary based on historical data and analyst forecasts only using an unbiased methodology and our articles are not intended to be financial advice. It does not constitute a recommendation to buy or sell any stock, and does not take account of your objectives, or your financial situation. We aim to bring you long-term focused analysis driven by fundamental data. Note that our analysis may not factor in the latest price-sensitive company announcements or qualitative material. Simply Wall St has no position in any stocks mentioned.
Join A Paid User Research Session
You’ll receive a US$30 Amazon Gift card for 1 hour of your time while helping us build better investing tools for the individual investors like yourself. Sign up here
