
 Yahoo Finance
 Shriro Holdings (ASX:SHM) Will Want To Turn Around Its Return Trends
If we want to find a potential multi-bagger, often there are underlying trends that can provide clues. Firstly, we'd want to identify a growing return on capital employed (ROCE) and then alongside that, an ever-increasing base of capital employed. If you see this, it typically means it's a company with a great business model and plenty of profitable reinvestment opportunities. However, after investigating Shriro Holdings (ASX:SHM), we don't think it's current trends fit the mold of a multi-bagger.
Understanding Return On Capital Employed (ROCE)
For those who don't know, ROCE is a measure of a company's yearly pre-tax profit (its return), relative to the capital employed in the business. The formula for this calculation on Shriro Holdings is:
Return on Capital Employed = Earnings Before Interest and Tax (EBIT) ÷ (Total Assets - Current Liabilities)
0.17 = AU$14m ÷ (AU$98m - AU$19m) (Based on the trailing twelve months to June 2023).
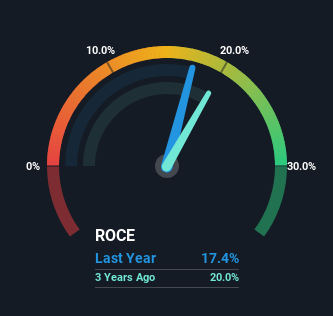
Thus, Shriro Holdings has an ROCE of 17%. In absolute terms, that's a satisfactory return, but compared to the Consumer Durables industry average of 7.8% it's much better.
View our latest analysis for Shriro Holdings
While the past is not representative of the future, it can be helpful to know how a company has performed historically, which is why we have this chart above. If you want to delve into the historical earnings, revenue and cash flow of Shriro Holdings, check out these free graphs here.
The Trend Of ROCE
On the surface, the trend of ROCE at Shriro Holdings doesn't inspire confidence. Around five years ago the returns on capital were 36%, but since then they've fallen to 17%. On the other hand, the company has been employing more capital without a corresponding improvement in sales in the last year, which could suggest these investments are longer term plays. It may take some time before the company starts to see any change in earnings from these investments.
On a related note, Shriro Holdings has decreased its current liabilities to 20% of total assets. So we could link some of this to the decrease in ROCE. What's more, this can reduce some aspects of risk to the business because now the company's suppliers or short-term creditors are funding less of its operations. Since the business is basically funding more of its operations with it's own money, you could argue this has made the business less efficient at generating ROCE.
In Conclusion...
In summary, Shriro Holdings is reinvesting funds back into the business for growth but unfortunately it looks like sales haven't increased much just yet. Investors must think there's better things to come because the stock has knocked it out of the park, delivering a 213% gain to shareholders who have held over the last five years. Ultimately, if the underlying trends persist, we wouldn't hold our breath on it being a multi-bagger going forward.
One more thing to note, we've identified 2 warning signs with Shriro Holdings and understanding these should be part of your investment process.
For those who like to invest in solid companies, check out this free list of companies with solid balance sheets and high returns on equity.
Have feedback on this article? Concerned about the content? Get in touch with us directly. Alternatively, email editorial-team (at) simplywallst.com.
This article by Simply Wall St is general in nature. We provide commentary based on historical data and analyst forecasts only using an unbiased methodology and our articles are not intended to be financial advice. It does not constitute a recommendation to buy or sell any stock, and does not take account of your objectives, or your financial situation. We aim to bring you long-term focused analysis driven by fundamental data. Note that our analysis may not factor in the latest price-sensitive company announcements or qualitative material. Simply Wall St has no position in any stocks mentioned.
