
 Yahoo Finance
 Shareholders in New Zealand Oil & Gas (NZSE:NZO) are in the red if they invested three years ago
As an investor its worth striving to ensure your overall portfolio beats the market average. But its virtually certain that sometimes you will buy stocks that fall short of the market average returns. We regret to report that long term New Zealand Oil & Gas Limited (NZSE:NZO) shareholders have had that experience, with the share price dropping 45% in three years, versus a market decline of about 9.6%.
So let's have a look and see if the longer term performance of the company has been in line with the underlying business' progress.
Check out our latest analysis for New Zealand Oil & Gas
While markets are a powerful pricing mechanism, share prices reflect investor sentiment, not just underlying business performance. By comparing earnings per share (EPS) and share price changes over time, we can get a feel for how investor attitudes to a company have morphed over time.
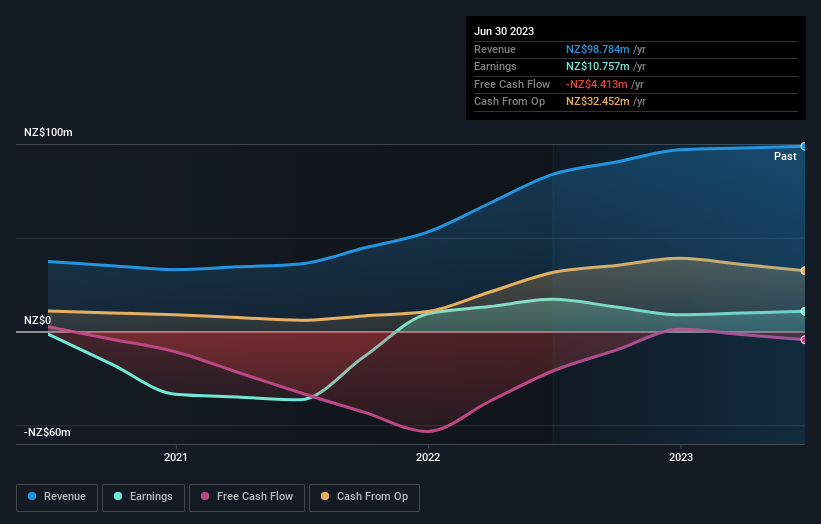
During five years of share price growth, New Zealand Oil & Gas moved from a loss to profitability. That would generally be considered a positive, so we are surprised to see the share price is down. So it's worth looking at other metrics to try to understand the share price move.
Revenue is actually up 43% over the three years, so the share price drop doesn't seem to hinge on revenue, either. It's probably worth investigating New Zealand Oil & Gas further; while we may be missing something on this analysis, there might also be an opportunity.
You can see how earnings and revenue have changed over time in the image below (click on the chart to see the exact values).
Balance sheet strength is crucial. It might be well worthwhile taking a look at our free report on how its financial position has changed over time.
What About The Total Shareholder Return (TSR)?
We'd be remiss not to mention the difference between New Zealand Oil & Gas' total shareholder return (TSR) and its share price return. Arguably the TSR is a more complete return calculation because it accounts for the value of dividends (as if they were reinvested), along with the hypothetical value of any discounted capital that have been offered to shareholders. Its history of dividend payouts mean that New Zealand Oil & Gas' TSR, which was a 43% drop over the last 3 years, was not as bad as the share price return.
A Different Perspective
We regret to report that New Zealand Oil & Gas shareholders are down 11% for the year. Unfortunately, that's worse than the broader market decline of 1.1%. However, it could simply be that the share price has been impacted by broader market jitters. It might be worth keeping an eye on the fundamentals, in case there's a good opportunity. Regrettably, last year's performance caps off a bad run, with the shareholders facing a total loss of 5% per year over five years. Generally speaking long term share price weakness can be a bad sign, though contrarian investors might want to research the stock in hope of a turnaround. While it is well worth considering the different impacts that market conditions can have on the share price, there are other factors that are even more important. For instance, we've identified 2 warning signs for New Zealand Oil & Gas that you should be aware of.
Of course, you might find a fantastic investment by looking elsewhere. So take a peek at this free list of companies we expect will grow earnings.
Please note, the market returns quoted in this article reflect the market weighted average returns of stocks that currently trade on New Zealander exchanges.
Have feedback on this article? Concerned about the content? Get in touch with us directly. Alternatively, email editorial-team (at) simplywallst.com.
This article by Simply Wall St is general in nature. We provide commentary based on historical data and analyst forecasts only using an unbiased methodology and our articles are not intended to be financial advice. It does not constitute a recommendation to buy or sell any stock, and does not take account of your objectives, or your financial situation. We aim to bring you long-term focused analysis driven by fundamental data. Note that our analysis may not factor in the latest price-sensitive company announcements or qualitative material. Simply Wall St has no position in any stocks mentioned.
