
 Yahoo Finance
 Shareholders in Springfield Properties (LON:SPR) are in the red if they invested a year ago
Investors can approximate the average market return by buying an index fund. While individual stocks can be big winners, plenty more fail to generate satisfactory returns. For example, the Springfield Properties Plc (LON:SPR) share price is down 28% in the last year. That falls noticeably short of the market decline of around 8.2%. At least the damage isn't so bad if you look at the last three years, since the stock is down 4.4% in that time. Unfortunately the share price momentum is still quite negative, with prices down 14% in thirty days. Importantly, this could be a market reaction to the recently released financial results. You can check out the latest numbers in our company report.
So let's have a look and see if the longer term performance of the company has been in line with the underlying business' progress.
Check out our latest analysis for Springfield Properties
In his essay The Superinvestors of Graham-and-Doddsville Warren Buffett described how share prices do not always rationally reflect the value of a business. One imperfect but simple way to consider how the market perception of a company has shifted is to compare the change in the earnings per share (EPS) with the share price movement.
During the unfortunate twelve months during which the Springfield Properties share price fell, it actually saw its earnings per share (EPS) improve by 20%. It could be that the share price was previously over-hyped.
The divergence between the EPS and the share price is quite notable, during the year. But we might find some different metrics explain the share price movements better.
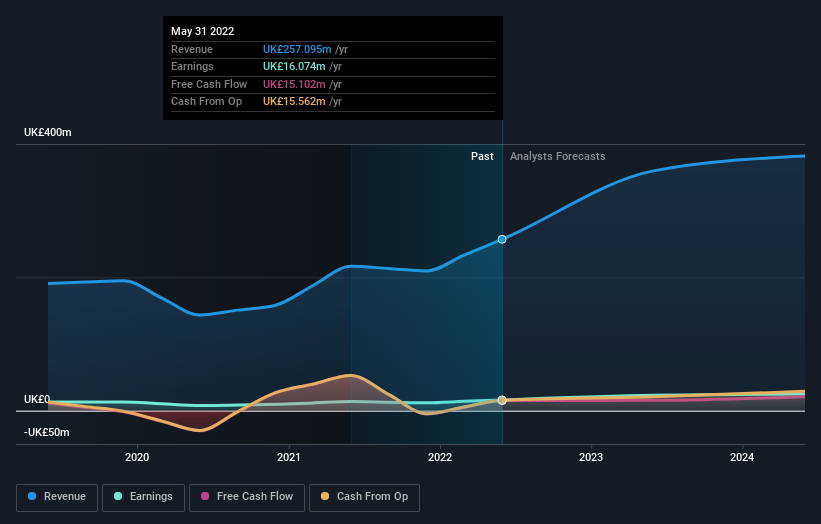
We don't see any weakness in the Springfield Properties' dividend so the steady payout can't really explain the share price drop. The revenue trend doesn't seem to explain why the share price is down. Unless, of course, the market was expecting a revenue uptick.
You can see how earnings and revenue have changed over time in the image below (click on the chart to see the exact values).
We know that Springfield Properties has improved its bottom line lately, but what does the future have in store? You can see what analysts are predicting for Springfield Properties in this interactive graph of future profit estimates.
What About Dividends?
As well as measuring the share price return, investors should also consider the total shareholder return (TSR). The TSR is a return calculation that accounts for the value of cash dividends (assuming that any dividend received was reinvested) and the calculated value of any discounted capital raisings and spin-offs. It's fair to say that the TSR gives a more complete picture for stocks that pay a dividend. As it happens, Springfield Properties' TSR for the last 1 year was -25%, which exceeds the share price return mentioned earlier. And there's no prize for guessing that the dividend payments largely explain the divergence!
A Different Perspective
Springfield Properties shareholders are down 25% for the year (even including dividends), falling short of the market return. Meanwhile, the broader market slid about 8.2%, likely weighing on the stock. Investors are up over three years, booking 1.8% per year, much better than the more recent returns. The recent sell-off could be an opportunity if the business remains sound, so it may be worth checking the fundamental data for signs of a long-term growth trend. While it is well worth considering the different impacts that market conditions can have on the share price, there are other factors that are even more important. Consider risks, for instance. Every company has them, and we've spotted 2 warning signs for Springfield Properties you should know about.
If you like to buy stocks alongside management, then you might just love this free list of companies. (Hint: insiders have been buying them).
Please note, the market returns quoted in this article reflect the market weighted average returns of stocks that currently trade on GB exchanges.
Have feedback on this article? Concerned about the content? Get in touch with us directly. Alternatively, email editorial-team (at) simplywallst.com.
This article by Simply Wall St is general in nature. We provide commentary based on historical data and analyst forecasts only using an unbiased methodology and our articles are not intended to be financial advice. It does not constitute a recommendation to buy or sell any stock, and does not take account of your objectives, or your financial situation. We aim to bring you long-term focused analysis driven by fundamental data. Note that our analysis may not factor in the latest price-sensitive company announcements or qualitative material. Simply Wall St has no position in any stocks mentioned.
Join A Paid User Research Session
You’ll receive a US$30 Amazon Gift card for 1 hour of your time while helping us build better investing tools for the individual investors like yourself. Sign up here
