
 Yahoo Finance
 Shareholders in International Cement Group (SGX:KUO) are in the red if they invested three years ago
For many investors, the main point of stock picking is to generate higher returns than the overall market. But its virtually certain that sometimes you will buy stocks that fall short of the market average returns. We regret to report that long term International Cement Group Ltd. (SGX:KUO) shareholders have had that experience, with the share price dropping 44% in three years, versus a market return of about 26%. Shareholders have had an even rougher run lately, with the share price down 14% in the last 90 days.
Since shareholders are down over the longer term, lets look at the underlying fundamentals over the that time and see if they've been consistent with returns.
Check out our latest analysis for International Cement Group
To quote Buffett, 'Ships will sail around the world but the Flat Earth Society will flourish. There will continue to be wide discrepancies between price and value in the marketplace...' One way to examine how market sentiment has changed over time is to look at the interaction between a company's share price and its earnings per share (EPS).
Although the share price is down over three years, International Cement Group actually managed to grow EPS by 20% per year in that time. Given the share price reaction, one might suspect that EPS is not a good guide to the business performance during the period (perhaps due to a one-off loss or gain). Or else the company was over-hyped in the past, and so its growth has disappointed.
Since the change in EPS doesn't seem to correlate with the change in share price, it's worth taking a look at other metrics.
We note that, in three years, revenue has actually grown at a 21% annual rate, so that doesn't seem to be a reason to sell shares. It's probably worth investigating International Cement Group further; while we may be missing something on this analysis, there might also be an opportunity.
The image below shows how earnings and revenue have tracked over time (if you click on the image you can see greater detail).
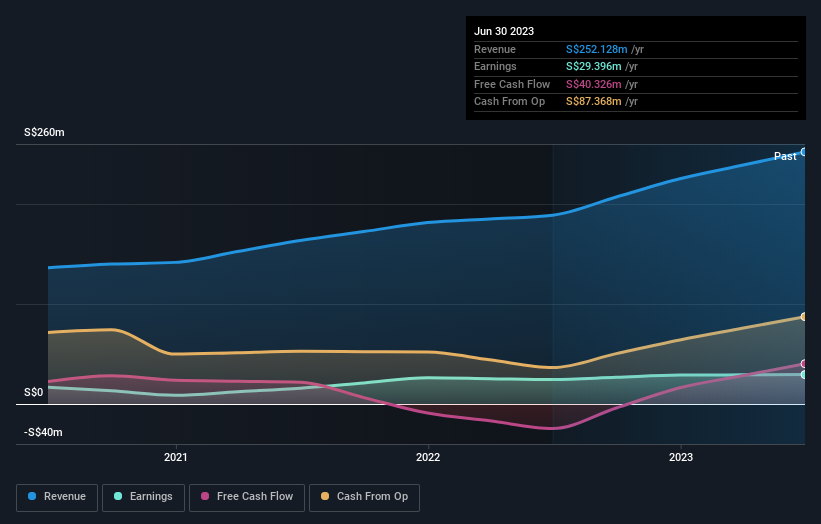
We're pleased to report that the CEO is remunerated more modestly than most CEOs at similarly capitalized companies. It's always worth keeping an eye on CEO pay, but a more important question is whether the company will grow earnings throughout the years. Dive deeper into the earnings by checking this interactive graph of International Cement Group's earnings, revenue and cash flow.
A Different Perspective
International Cement Group shareholders are down 17% for the year, but the market itself is up 2.5%. However, keep in mind that even the best stocks will sometimes underperform the market over a twelve month period. Regrettably, last year's performance caps off a bad run, with the shareholders facing a total loss of 6% per year over five years. We realise that Baron Rothschild has said investors should "buy when there is blood on the streets", but we caution that investors should first be sure they are buying a high quality business. It's always interesting to track share price performance over the longer term. But to understand International Cement Group better, we need to consider many other factors. Consider risks, for instance. Every company has them, and we've spotted 2 warning signs for International Cement Group you should know about.
Of course International Cement Group may not be the best stock to buy. So you may wish to see this free collection of growth stocks.
Please note, the market returns quoted in this article reflect the market weighted average returns of stocks that currently trade on Singaporean exchanges.
Have feedback on this article? Concerned about the content? Get in touch with us directly. Alternatively, email editorial-team (at) simplywallst.com.
This article by Simply Wall St is general in nature. We provide commentary based on historical data and analyst forecasts only using an unbiased methodology and our articles are not intended to be financial advice. It does not constitute a recommendation to buy or sell any stock, and does not take account of your objectives, or your financial situation. We aim to bring you long-term focused analysis driven by fundamental data. Note that our analysis may not factor in the latest price-sensitive company announcements or qualitative material. Simply Wall St has no position in any stocks mentioned.
