
 Yahoo Finance
 Shareholders Would Enjoy A Repeat Of Universal Music Group's (AMS:UMG) Recent Growth In Returns
If we want to find a potential multi-bagger, often there are underlying trends that can provide clues. In a perfect world, we'd like to see a company investing more capital into its business and ideally the returns earned from that capital are also increasing. If you see this, it typically means it's a company with a great business model and plenty of profitable reinvestment opportunities. Speaking of which, we noticed some great changes in Universal Music Group's (AMS:UMG) returns on capital, so let's have a look.
What Is Return On Capital Employed (ROCE)?
Just to clarify if you're unsure, ROCE is a metric for evaluating how much pre-tax income (in percentage terms) a company earns on the capital invested in its business. The formula for this calculation on Universal Music Group is:
Return on Capital Employed = Earnings Before Interest and Tax (EBIT) ÷ (Total Assets - Current Liabilities)
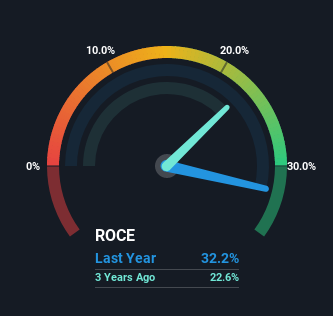
0.32 = €1.6b ÷ (€12b - €6.5b) (Based on the trailing twelve months to December 2022).
So, Universal Music Group has an ROCE of 32%. That's a fantastic return and not only that, it outpaces the average of 14% earned by companies in a similar industry.
See our latest analysis for Universal Music Group
In the above chart we have measured Universal Music Group's prior ROCE against its prior performance, but the future is arguably more important. If you'd like, you can check out the forecasts from the analysts covering Universal Music Group here for free.
So How Is Universal Music Group's ROCE Trending?
Universal Music Group's ROCE growth is quite impressive. Looking at the data, we can see that even though capital employed in the business has remained relatively flat, the ROCE generated has risen by 42% over the last three years. Basically the business is generating higher returns from the same amount of capital and that is proof that there are improvements in the company's efficiencies. It's worth looking deeper into this though because while it's great that the business is more efficient, it might also mean that going forward the areas to invest internally for the organic growth are lacking.
On a separate but related note, it's important to know that Universal Music Group has a current liabilities to total assets ratio of 56%, which we'd consider pretty high. This can bring about some risks because the company is basically operating with a rather large reliance on its suppliers or other sorts of short-term creditors. While it's not necessarily a bad thing, it can be beneficial if this ratio is lower.
Our Take On Universal Music Group's ROCE
To sum it up, Universal Music Group is collecting higher returns from the same amount of capital, and that's impressive. And given the stock has remained rather flat over the last year, there might be an opportunity here if other metrics are strong. So researching this company further and determining whether or not these trends will continue seems justified.
One more thing to note, we've identified 2 warning signs with Universal Music Group and understanding these should be part of your investment process.
High returns are a key ingredient to strong performance, so check out our free list ofstocks earning high returns on equity with solid balance sheets.
Have feedback on this article? Concerned about the content? Get in touch with us directly. Alternatively, email editorial-team (at) simplywallst.com.
This article by Simply Wall St is general in nature. We provide commentary based on historical data and analyst forecasts only using an unbiased methodology and our articles are not intended to be financial advice. It does not constitute a recommendation to buy or sell any stock, and does not take account of your objectives, or your financial situation. We aim to bring you long-term focused analysis driven by fundamental data. Note that our analysis may not factor in the latest price-sensitive company announcements or qualitative material. Simply Wall St has no position in any stocks mentioned.
Join A Paid User Research Session
You’ll receive a US$30 Amazon Gift card for 1 hour of your time while helping us build better investing tools for the individual investors like yourself. Sign up here
