
 Yahoo Finance
 Shareholders Would Enjoy A Repeat Of NVE's (NASDAQ:NVEC) Recent Growth In Returns
Finding a business that has the potential to grow substantially is not easy, but it is possible if we look at a few key financial metrics. In a perfect world, we'd like to see a company investing more capital into its business and ideally the returns earned from that capital are also increasing. Ultimately, this demonstrates that it's a business that is reinvesting profits at increasing rates of return. So when we looked at the ROCE trend of NVE (NASDAQ:NVEC) we really liked what we saw.
What Is Return On Capital Employed (ROCE)?
For those that aren't sure what ROCE is, it measures the amount of pre-tax profits a company can generate from the capital employed in its business. Analysts use this formula to calculate it for NVE:
Return on Capital Employed = Earnings Before Interest and Tax (EBIT) ÷ (Total Assets - Current Liabilities)
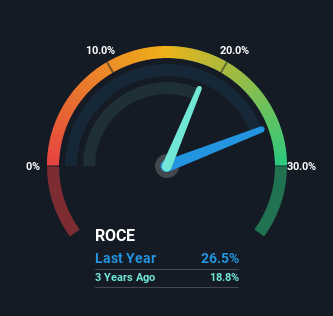
0.26 = US$17m ÷ (US$65m - US$1.1m) (Based on the trailing twelve months to June 2022).
Thus, NVE has an ROCE of 26%. That's a fantastic return and not only that, it outpaces the average of 15% earned by companies in a similar industry.
Check out our latest analysis for NVE
While the past is not representative of the future, it can be helpful to know how a company has performed historically, which is why we have this chart above. If you're interested in investigating NVE's past further, check out this free graph of past earnings, revenue and cash flow.
How Are Returns Trending?
NVE has not disappointed in regards to ROCE growth. We found that the returns on capital employed over the last five years have risen by 36%. The company is now earning US$0.3 per dollar of capital employed. Interestingly, the business may be becoming more efficient because it's applying 30% less capital than it was five years ago. If this trend continues, the business might be getting more efficient but it's shrinking in terms of total assets.
The Key Takeaway
In a nutshell, we're pleased to see that NVE has been able to generate higher returns from less capital. And given the stock has remained rather flat over the last five years, there might be an opportunity here if other metrics are strong. So researching this company further and determining whether or not these trends will continue seems justified.
On a separate note, we've found 2 warning signs for NVE you'll probably want to know about.
If you'd like to see other companies earning high returns, check out our free list of companies earning high returns with solid balance sheets here.
Have feedback on this article? Concerned about the content? Get in touch with us directly. Alternatively, email editorial-team (at) simplywallst.com.
This article by Simply Wall St is general in nature. We provide commentary based on historical data and analyst forecasts only using an unbiased methodology and our articles are not intended to be financial advice. It does not constitute a recommendation to buy or sell any stock, and does not take account of your objectives, or your financial situation. We aim to bring you long-term focused analysis driven by fundamental data. Note that our analysis may not factor in the latest price-sensitive company announcements or qualitative material. Simply Wall St has no position in any stocks mentioned.
Join A Paid User Research Session
You’ll receive a US$30 Amazon Gift card for 1 hour of your time while helping us build better investing tools for the individual investors like yourself. Sign up here
