
 Yahoo Finance
 Shareholders in Ebang International Holdings (NASDAQ:EBON) are in the red if they invested a year ago
As every investor would know, you don't hit a homerun every time you swing. But serious investors should think long and hard about avoiding extreme losses. So we hope that those who held Ebang International Holdings Inc. (NASDAQ:EBON) during the last year don't lose the lesson, in addition to the 73% hit to the value of their shares. A loss like this is a stark reminder that portfolio diversification is important. Ebang International Holdings hasn't been listed for long, so although we're wary of recent listings that perform poorly, it may still prove itself with time. Unfortunately the share price momentum is still quite negative, with prices down 19% in thirty days. We do note, however, that the broader market is down 9.5% in that period, and this may have weighed on the share price.
Since shareholders are down over the longer term, lets look at the underlying fundamentals over the that time and see if they've been consistent with returns.
Check out our latest analysis for Ebang International Holdings
In his essay The Superinvestors of Graham-and-Doddsville Warren Buffett described how share prices do not always rationally reflect the value of a business. One way to examine how market sentiment has changed over time is to look at the interaction between a company's share price and its earnings per share (EPS).
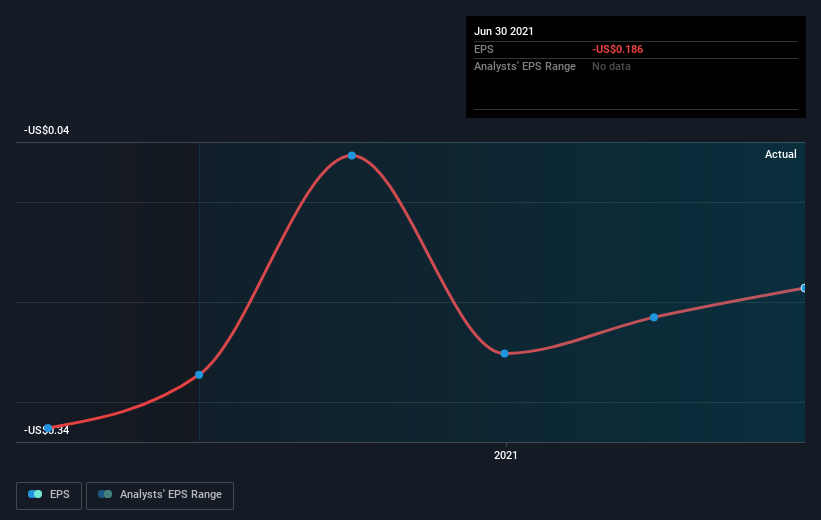
During the last year Ebang International Holdings grew its earnings per share, moving from a loss to a profit.
We're surprised that the share price is lower given that improvement. If the company can sustain the earnings growth, this might be an inflection point for the business, which would make right now a really interesting time to study it more closely.
You can see below how EPS has changed over time (discover the exact values by clicking on the image).
Dive deeper into Ebang International Holdings' key metrics by checking this interactive graph of Ebang International Holdings's earnings, revenue and cash flow.
A Different Perspective
We doubt Ebang International Holdings shareholders are happy with the loss of 73% over twelve months. That falls short of the market, which lost 6.9%. There's no doubt that's a disappointment, but the stock may well have fared better in a stronger market. With the stock down 12% over the last three months, the market doesn't seem to believe that the company has solved all its problems. Basically, most investors should be wary of buying into a poor-performing stock, unless the business itself has clearly improved. It's always interesting to track share price performance over the longer term. But to understand Ebang International Holdings better, we need to consider many other factors. For instance, we've identified 2 warning signs for Ebang International Holdings (1 doesn't sit too well with us) that you should be aware of.
If you like to buy stocks alongside management, then you might just love this free list of companies. (Hint: insiders have been buying them).
Please note, the market returns quoted in this article reflect the market weighted average returns of stocks that currently trade on US exchanges.
Have feedback on this article? Concerned about the content? Get in touch with us directly. Alternatively, email editorial-team (at) simplywallst.com.
This article by Simply Wall St is general in nature. We provide commentary based on historical data and analyst forecasts only using an unbiased methodology and our articles are not intended to be financial advice. It does not constitute a recommendation to buy or sell any stock, and does not take account of your objectives, or your financial situation. We aim to bring you long-term focused analysis driven by fundamental data. Note that our analysis may not factor in the latest price-sensitive company announcements or qualitative material. Simply Wall St has no position in any stocks mentioned.
