
 Yahoo Finance
 Shareholders in Camellia (LON:CAM) are in the red if they invested three years ago
In order to justify the effort of selecting individual stocks, it's worth striving to beat the returns from a market index fund. But its virtually certain that sometimes you will buy stocks that fall short of the market average returns. Unfortunately, that's been the case for longer term Camellia Plc (LON:CAM) shareholders, since the share price is down 38% in the last three years, falling well short of the market return of around 27%.
So let's have a look and see if the longer term performance of the company has been in line with the underlying business' progress.
Check out our latest analysis for Camellia
We don't think that Camellia's modest trailing twelve month profit has the market's full attention at the moment. We think revenue is probably a better guide. As a general rule, we think this kind of company is more comparable to loss-making stocks, since the actual profit is so low. It would be hard to believe in a more profitable future without growing revenues.
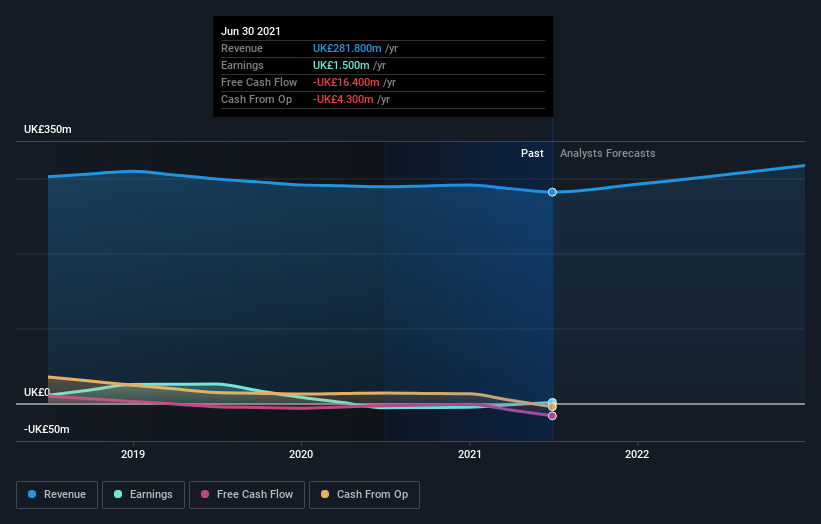
In the last three years Camellia saw its revenue shrink by 2.7% per year. That's not what investors generally want to see. The stock has disappointed holders over the last three years, falling 11%, annualized. And with no profits, and weak revenue, are you surprised? Of course, sentiment could become too negative, and the company may actually be making progress to profitability.
The image below shows how earnings and revenue have tracked over time (if you click on the image you can see greater detail).
We know that Camellia has improved its bottom line lately, but what does the future have in store? You can see what analysts are predicting for Camellia in this interactive graph of future profit estimates.
What About Dividends?
As well as measuring the share price return, investors should also consider the total shareholder return (TSR). The TSR is a return calculation that accounts for the value of cash dividends (assuming that any dividend received was reinvested) and the calculated value of any discounted capital raisings and spin-offs. Arguably, the TSR gives a more comprehensive picture of the return generated by a stock. In the case of Camellia, it has a TSR of -35% for the last 3 years. That exceeds its share price return that we previously mentioned. And there's no prize for guessing that the dividend payments largely explain the divergence!
A Different Perspective
Investors in Camellia had a tough year, with a total loss of 2.0% (including dividends), against a market gain of about 14%. Even the share prices of good stocks drop sometimes, but we want to see improvements in the fundamental metrics of a business, before getting too interested. Unfortunately, longer term shareholders are suffering worse, given the loss of 5% doled out over the last five years. We would want clear information suggesting the company will grow, before taking the view that the share price will stabilize. It's always interesting to track share price performance over the longer term. But to understand Camellia better, we need to consider many other factors. Case in point: We've spotted 2 warning signs for Camellia you should be aware of, and 1 of them is concerning.
Of course, you might find a fantastic investment by looking elsewhere. So take a peek at this free list of companies we expect will grow earnings.
Please note, the market returns quoted in this article reflect the market weighted average returns of stocks that currently trade on GB exchanges.
Have feedback on this article? Concerned about the content? Get in touch with us directly. Alternatively, email editorial-team (at) simplywallst.com.
This article by Simply Wall St is general in nature. We provide commentary based on historical data and analyst forecasts only using an unbiased methodology and our articles are not intended to be financial advice. It does not constitute a recommendation to buy or sell any stock, and does not take account of your objectives, or your financial situation. We aim to bring you long-term focused analysis driven by fundamental data. Note that our analysis may not factor in the latest price-sensitive company announcements or qualitative material. Simply Wall St has no position in any stocks mentioned.
