
 Yahoo Finance
 Sempra Energy (NYSE:SRE) sheds 3.0% this week, as yearly returns fall more in line with earnings growth
The main point of investing for the long term is to make money. But more than that, you probably want to see it rise more than the market average. Unfortunately for shareholders, while the Sempra Energy (NYSE:SRE) share price is up 44% in the last five years, that's less than the market return. But if you include dividends then the return is market-beating. The last year has been disappointing, with the stock price down 4.7% in that time.
Since the long term performance has been good but there's been a recent pullback of 3.0%, let's check if the fundamentals match the share price.
Check out our latest analysis for Sempra Energy
While the efficient markets hypothesis continues to be taught by some, it has been proven that markets are over-reactive dynamic systems, and investors are not always rational. One way to examine how market sentiment has changed over time is to look at the interaction between a company's share price and its earnings per share (EPS).
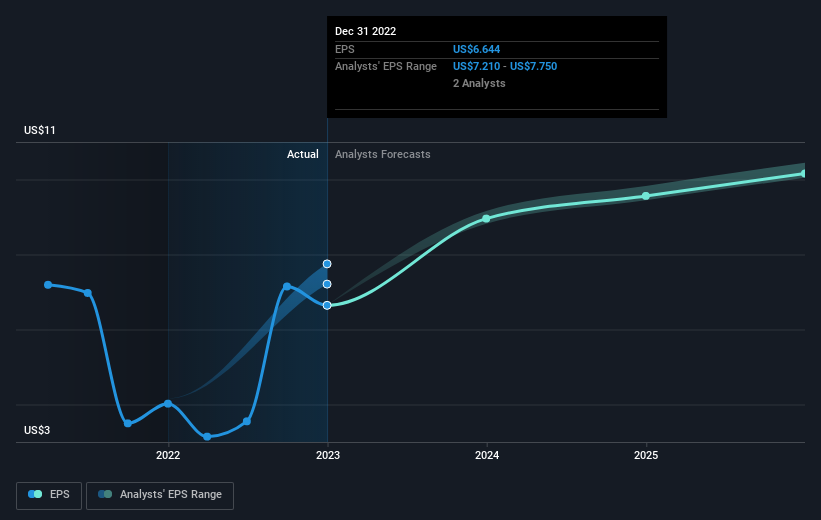
Over half a decade, Sempra Energy managed to grow its earnings per share at 42% a year. This EPS growth is higher than the 8% average annual increase in the share price. Therefore, it seems the market has become relatively pessimistic about the company.
You can see how EPS has changed over time in the image below (click on the chart to see the exact values).
We know that Sempra Energy has improved its bottom line lately, but is it going to grow revenue? If you're interested, you could check this free report showing consensus revenue forecasts.
What About Dividends?
When looking at investment returns, it is important to consider the difference between total shareholder return (TSR) and share price return. Whereas the share price return only reflects the change in the share price, the TSR includes the value of dividends (assuming they were reinvested) and the benefit of any discounted capital raising or spin-off. Arguably, the TSR gives a more comprehensive picture of the return generated by a stock. We note that for Sempra Energy the TSR over the last 5 years was 69%, which is better than the share price return mentioned above. This is largely a result of its dividend payments!
A Different Perspective
While it's never nice to take a loss, Sempra Energy shareholders can take comfort that , including dividends,their trailing twelve month loss of 1.7% wasn't as bad as the market loss of around 2.6%. Of course, the long term returns are far more important and the good news is that over five years, the stock has returned 11% for each year. It could be that the business is just facing some short term problems, but shareholders should keep a close eye on the fundamentals. It's always interesting to track share price performance over the longer term. But to understand Sempra Energy better, we need to consider many other factors. Consider for instance, the ever-present spectre of investment risk. We've identified 2 warning signs with Sempra Energy (at least 1 which is significant) , and understanding them should be part of your investment process.
We will like Sempra Energy better if we see some big insider buys. While we wait, check out this free list of growing companies with considerable, recent, insider buying.
Please note, the market returns quoted in this article reflect the market weighted average returns of stocks that currently trade on American exchanges.
Have feedback on this article? Concerned about the content? Get in touch with us directly. Alternatively, email editorial-team (at) simplywallst.com.
This article by Simply Wall St is general in nature. We provide commentary based on historical data and analyst forecasts only using an unbiased methodology and our articles are not intended to be financial advice. It does not constitute a recommendation to buy or sell any stock, and does not take account of your objectives, or your financial situation. We aim to bring you long-term focused analysis driven by fundamental data. Note that our analysis may not factor in the latest price-sensitive company announcements or qualitative material. Simply Wall St has no position in any stocks mentioned.
Join A Paid User Research Session
You’ll receive a US$30 Amazon Gift card for 1 hour of your time while helping us build better investing tools for the individual investors like yourself. Sign up here
