
 Yahoo Finance
 How Has SEEK Limited’s (ASX:SEK) Performed Against The Industry?

In this commentary, I will examine SEEK Limited’s (ASX:SEK) latest earnings update (31 December 2017) and compare these figures against its performance over the past couple of years, as well as how the rest of the professional services industry performed. As an investor, I find it beneficial to assess SEK’s trend over the short-to-medium term in order to gauge whether or not the company is able to meet its goals, and ultimately sustainably grow over time.
See our latest analysis for SEEK
Did SEK’s recent earnings growth beat the long-term trend and the industry?
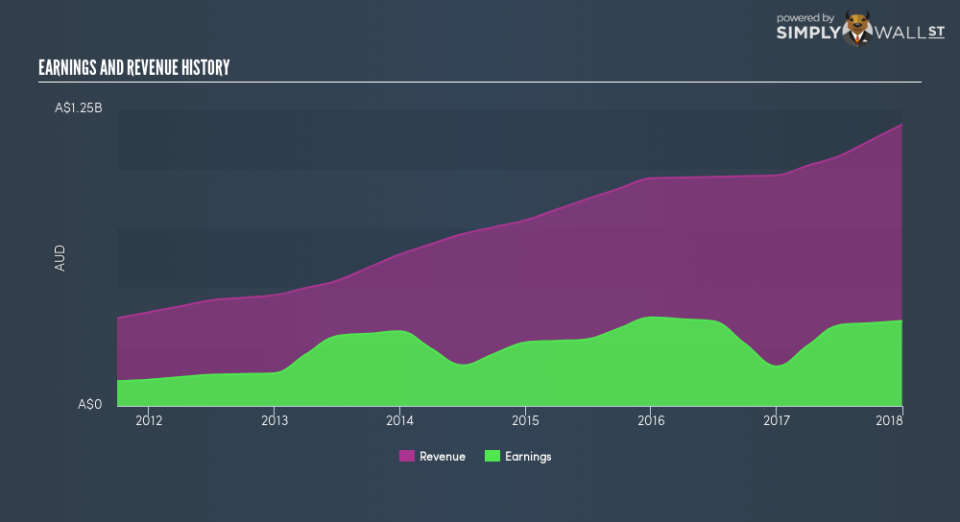
SEK’s trailing twelve-month earnings (from 31 December 2017) of AU$358.10m has more than doubled from AU$357.10m in the prior year. Furthermore, this one-year growth rate has exceeded its 5-year annual growth average of 13.74%, indicating the rate at which SEK is growing has accelerated. How has it been able to do this? Let’s take a look at if it is merely a result of an industry uplift, or if SEEK has seen some company-specific growth.
The climb in earnings seems to be supported by a strong top-line increase outpacing its growth rate of expenses. Though this has led to a margin contraction, it has made SEEK more profitable. Scanning growth from a sector-level, the Australian professional services industry has been enduring some headwinds in the past year, leading to an average earnings drop of -4.71%. This is a momentous change, given that the industry has been delivering a positive rate of 3.08%, on average, over the previous five years. This growth is a median of profitable companies of 10 Professional Services companies in AU including Veris, Ambition Group and ALS. This means any near-term headwind the industry is enduring, the impact on SEEK has been softer relative to its peers.
In terms of returns from investment, SEEK has fallen short of achieving a 20% return on equity (ROE), recording 19.90% instead. However, its return on assets (ROA) of 10.43% exceeds the AU Professional Services industry of 6.80%, indicating SEEK has used its assets more efficiently. And finally, its return on capital (ROC), which also accounts for SEEK’s debt level, has increased over the past 3 years from 9.30% to 9.58%.
What does this mean?
While past data is useful, it doesn’t tell the whole story. While SEEK has a good historical track record with positive growth and profitability, there’s no certainty that this will extrapolate into the future. I suggest you continue to research SEEK to get a better picture of the stock by looking at:
Future Outlook: What are well-informed industry analysts predicting for SEK’s future growth? Take a look at our free research report of analyst consensus for SEK’s outlook.
Financial Health: Are SEK’s operations financially sustainable? Balance sheets can be hard to analyze, which is why we’ve done it for you. Check out our financial health checks here.
Other High-Performing Stocks: Are there other stocks that provide better prospects with proven track records? Explore our free list of these great stocks here.
NB: Figures in this article are calculated using data from the trailing twelve months from 31 December 2017. This may not be consistent with full year annual report figures.
To help readers see past the short term volatility of the financial market, we aim to bring you a long-term focused research analysis purely driven by fundamental data. Note that our analysis does not factor in the latest price-sensitive company announcements.
The author is an independent contributor and at the time of publication had no position in the stocks mentioned. For errors that warrant correction please contact the editor at editorial-team@simplywallst.com.
