
 Yahoo Finance
 Can We See Significant Institutional Ownership On The Sands China Ltd. (HKG:1928) Share Register?

A look at the shareholders of Sands China Ltd. (HKG:1928) can tell us which group is most powerful. Institutions will often hold stock in bigger companies, and we expect to see insiders owning a noticeable percentage of the smaller ones. Companies that have been privatized tend to have low insider ownership.
With a market capitalization of HK$278b, Sands China is rather large. We’d expect to see institutional investors on the register. Companies of this size are usually well known to retail investors, too. Taking a look at the our data on the ownership groups (below), it’s seems that institutions own shares in the company. We can zoom in on the different ownership groups, to learn more about 1928.
View our latest analysis for Sands China
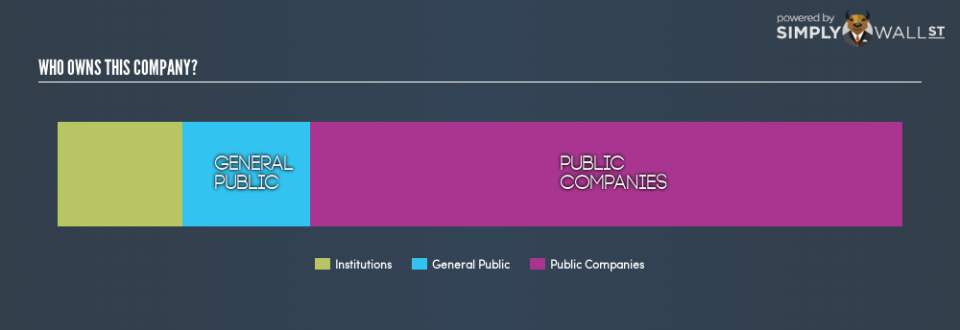
What Does The Institutional Ownership Tell Us About Sands China?
Many institutions measure their performance against an index that approximates the local market. So they usually pay more attention to companies that are included in major indices.
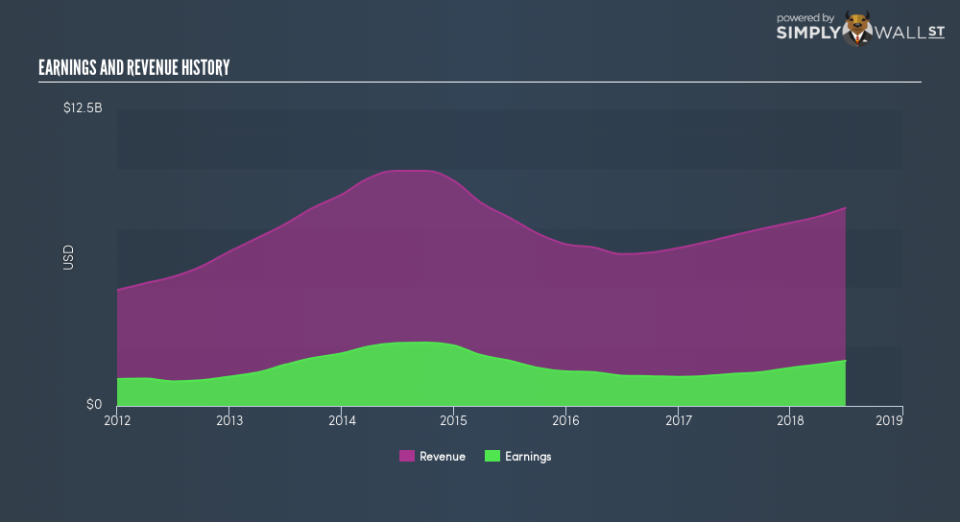
We can see that Sands China does have institutional investors; and they hold 15% of the stock. This implies the analysts working for those institutions have looked at the stock and they like it. But just like anyone else, they could be wrong. If multiple institutions change their view on a stock at the same time, you could see the share price drop fast. It’s therefore worth looking at Sands China’s earnings history, below. Of course, the future is what really matters.
We note that hedge funds don’t have a meaningful investment in Sands China. There are a reasonable number of analysts covering the stock, so it might be useful to find out their aggregate view on the future.
Insider Ownership Of Sands China
While the precise definition of an insider can be subjective, almost everyone considers board members to be insiders. The company management answer to the board; and the latter should represent the interests of shareholders. Notably, sometimes top-level managers are on the board, themselves.
I generally consider insider ownership to be a good thing. However, on some occasions it makes it more difficult for other shareholders to hold the board accountable for decisions.
Our data cannot confirm that board members are holding shares personally. It is rare to see such a low level of personal ownership, amongst the board (and it is possible that our data might be incomplete). Concerned investors should check here to see if insiders have been selling or buying.
General Public Ownership
With a 15% ownership, the general public have some degree of sway over 1928. While this group can’t necessarily call the shots, it can certainly have a real influence on how the company is run.
Public Company Ownership
Public companies currently own 70% of 1928 stock. It’s hard to say for sure, but this suggests they have entwined business interests. This might be a strategic stake, so it’s worth watching this space for changes in ownership.
Next Steps:
While it is well worth considering the different groups that own a company, there are other factors that are even more important.
I like to dive deeper into how a company has performed in the past. You can find historic revenue and earnings in this detailed graph.
If you would prefer discover what analysts are predicting in terms of future growth, do not miss this free report on analyst forecasts.
NB: Figures in this article are calculated using data from the last twelve months, which refer to the 12-month period ending on the last date of the month the financial statement is dated. This may not be consistent with full year annual report figures.
To help readers see past the short term volatility of the financial market, we aim to bring you a long-term focused research analysis purely driven by fundamental data. Note that our analysis does not factor in the latest price-sensitive company announcements.
The author is an independent contributor and at the time of publication had no position in the stocks mentioned. For errors that warrant correction please contact the editor at editorial-team@simplywallst.com.
