
 Yahoo Finance
 Can We See Significant Insider Ownership On The Infront ASA (OB:INFRNT) Share Register?

The big shareholder groups in Infront ASA (OB:INFRNT) have power over the company. Generally speaking, as a company grows, institutions will increase their ownership. Conversely, insiders often decrease their ownership over time. Warren Buffett said that he likes 'a business with enduring competitive advantages that is run by able and owner-oriented people'. So it's nice to see some insider ownership, because it may suggest that management is owner-oriented.
Infront is a smaller company with a market capitalization of kr849m, so it may still be flying under the radar of many institutional investors. In the chart below below, we can see that institutions own shares in the company. Let's take a closer look to see what the different types of shareholder can tell us about INFRNT.
Check out our latest analysis for Infront
What Does The Institutional Ownership Tell Us About Infront?
Institutions typically measure themselves against a benchmark when reporting to their own investors, so they often become more enthusiastic about a stock once it's included in a major index. We would expect most companies to have some institutions on the register, especially if they are growing.
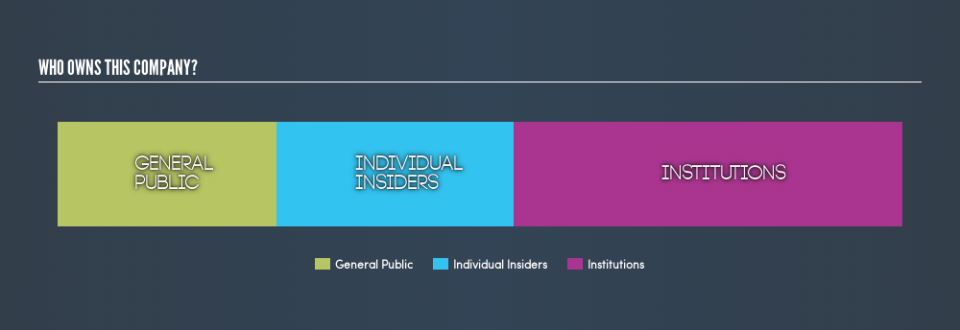
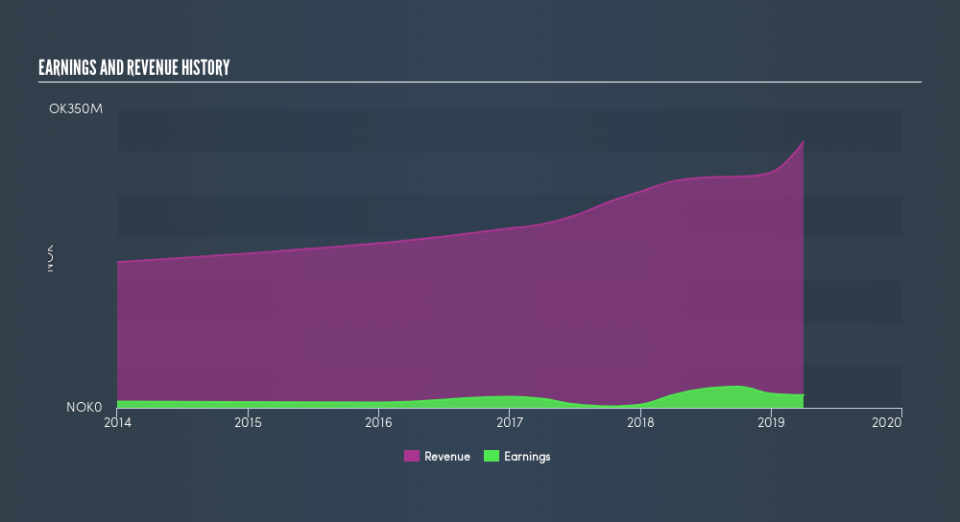
Infront already has institutions on the share registry. Indeed, they own 46% of the company. This implies the analysts working for those institutions have looked at the stock and they like it. But just like anyone else, they could be wrong. When multiple institutions own a stock, there's always a risk that they are in a 'crowded trade'. When such a trade goes wrong, multiple parties may compete to sell stock fast. This risk is higher in a company without a history of growth. You can see Infront's historic earnings and revenue, below, but keep in mind there's always more to the story.
Infront is not owned by hedge funds. While there is some analyst coverage, the company is probably not widely covered. So it could gain more attention, down the track.
Insider Ownership Of Infront
While the precise definition of an insider can be subjective, almost everyone considers board members to be insiders. Company management run the business, but the CEO will answer to the board, even if he or she is a member of it.
I generally consider insider ownership to be a good thing. However, on some occasions it makes it more difficult for other shareholders to hold the board accountable for decisions.
Our information suggests that insiders maintain a significant holding in Infront ASA. It has a market capitalization of just kr849m, and insiders have kr239m worth of shares in their own names. I would say this shows alignment with shareholders, but it is worth noting that the company is still quite small; some insiders may have founded the business. You can click here to see if those insiders have been buying or selling.
General Public Ownership
The general public holds a 26% stake in INFRNT. This size of ownership, while considerable, may not be enough to change company policy if the decision is not in sync with other large shareholders.
Next Steps:
I find it very interesting to look at who exactly owns a company. But to truly gain insight, we need to consider other information, too.
I always like to check for a history of revenue growth. You can too, by accessing this free chart of historic revenue and earnings in this detailed graph.
If you would prefer discover what analysts are predicting in terms of future growth, do not miss this free report on analyst forecasts.
NB: Figures in this article are calculated using data from the last twelve months, which refer to the 12-month period ending on the last date of the month the financial statement is dated. This may not be consistent with full year annual report figures.
We aim to bring you long-term focused research analysis driven by fundamental data. Note that our analysis may not factor in the latest price-sensitive company announcements or qualitative material.
If you spot an error that warrants correction, please contact the editor at editorial-team@simplywallst.com. This article by Simply Wall St is general in nature. It does not constitute a recommendation to buy or sell any stock, and does not take account of your objectives, or your financial situation. Simply Wall St has no position in the stocks mentioned. Thank you for reading.
