
 Yahoo Finance
 How to Screen Currency Pairs
Traders coming from stock markets are likely familiar with the concept of a ‘stock screener.’
For those that are fortunate to have found the FX Market before equities - stock traders are posed with the constant conundrum of ‘what stock should I trade?’
With more than 15,000 choices, narrowing down one or two stocks that may be amenable to the traders’ goals can be a challenge in-and-of-itself. Traders can ‘screen’ or filter amongst industries, share prices, earnings, growth numbers, and a whole flurry of other statistics in an effort to find what may be the most promising share(s).
Currency traders don’t have such a dilemma, as there is a far more palatable range of options available in the FX Market. On top of that, traders can cover most of the popular currency pairs by simply following the 7 largest ‘majors’ and instituting strong-weak analysis in the manner we had looked at in the article ‘How to Separate the Strong from the Weak.’ Doing so allows traders to utilize cross pairs such as EURAUD simply by following the major constituents of the pair (EURUSD and AUDUSD).
Screening based on Fundamentals
Particularly interesting to traders is what MAY happen in the future, as opposed to what had happened in the past. While technical analysis can give traders endless amounts of information to be taken in to account, it will never be perfectly predictive of what MAY happen. Large future price movements are often initiated around news releases or announcements.
These news announcements can create considerable volatility, and potentially even change the near-term perspective of traders speculating in these pairs. As such, it is often advisable for traders to have a general idea of what is on the economic docket for the geographies that represent the currencies that they are trading.
Upcoming announcements with ‘High Importance’ can bring on significant movement. Traders looking to trade breakouts, or fast markets can be well served to look for that type of price behavior around these ‘high importance’ events for the pairs that they are trading. Traders looking to trade range-bound or quiet markets are often looking to avoid these events, choosing instead to wait for this price movement
For traders looking to follow this data, there are few locations, if any, better than the DailyFX Economic calendar. From this calendar, traders can screen and filter announcements based on their own specific goals. Traders can filter for ‘High Importance’ announcements that could bring considerable volatility into the picture, or they can go a step further by filtering for announcements specific to a particular economy. The picture below will illustrate, with annotations added to point out some of the high points of the page.

The DailyFX Economic Calendar with annotations; by James Stanley
Upcoming announcements with ‘High Importance’ can bring on significant movement. Traders looking to trade breakouts, or fast markets can be well served to look for that type of price behavior around these ‘high importance’ events for the pairs that they are trading.
For instance, if a trader wants to trade breakouts on EURUSD, they can filter ‘High’ Importance, and filter EUR and USD announcements to arrive at a list of events that could potentially offer the price movements they are looking to take advantage of. The picture below will show the calendar filtered for EUR and USD announcements deemed ‘High Importance.’

These breakout traders will often want to look to place entry orders going into the announcement, looking for a break of support or resistance during or shortly after the release of the data.
Range traders, on the other hand, will often want to avoid these periods, as the additional volatility presented during the ‘High Impact’ announcements can potentially bring very quick breaks of support and/or resistance.
Screening based on Technicals
Traders looking to screen currency pairs based on past price behavior can do so with the process we walked through in the article How to Separate the Strong from the Weak.
In the article, we show traders how to build the following table, which will show the percentage gain or loss of the major currency pairs that have the constant of the US Dollar:
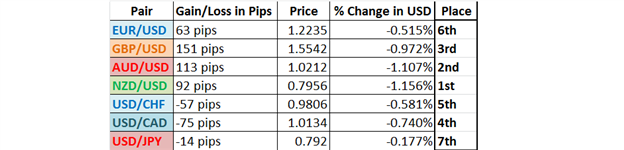
Taken from How to Separate the Strong from the Weak
After traders have analyzed which currencies have been strongest and which have been weakest, they can then begin to build their approach based on their goals.
For traders looking to trade in trending markets, much like we had looked at in Trading Trends by Trailing Stops with Price Swings, focus would want to be geared towards finding the strongest, and the weakest currency – and marrying them together to find the cross pair that may be the most attractive for our purposes.
In the above graph, NZD was the strongest currency, and USD the weakest (8th place, unlisted as that was the common thread amongst the 7 followed majors).
So, a trader looking to trade a strong trend can focus on a long NZDUSD position as NZD was the strongest, and USD was the weakest currency during the analyzed period; and this currency pair would be a combination of the strongest, and the weakest. And of course, our trader would want to focus on buying the strongest while selling the weakest and going long NZDUSD would allow them to do so.
If, for any reason, a trader wanted to avoid the NZDUSD pairing, they could look at a Long AUDJPY trade. AUD was shown as the 2nd strongest currency in the above analysis, while JPY was shown as the 2nd weakest currency, and marrying these two together would provide the same type of function as the previously analyzed NZDUSD trade.
In our next article, we’ll look at how we can combine these two competing forms of analysis to build an approach utilizing both technical and fundamental analysis based on the type(s) of market conditions desired.
--- Written by James B. Stanley
To contact James Stanley, please email Instructor@DailyFX.Com. You can follow James on Twitter @JStanleyFX.
To be added to James’ distribution list, please send an email with the subject line “Notification,” to Instructor@DailyFX.com.
How to Build a Complete Trading Strategy
How to Separate the Strong from the Weak
