
 Yahoo Finance
 As Schroders (LON:SDR) rallies 4.6% this past week, investors may now be noticing the company's one-year earnings growth
Schroders plc (LON:SDR) shareholders should be happy to see the share price up 10% in the last month. But in truth the last year hasn't been good for the share price. In fact, the price has declined 32% in a year, falling short of the returns you could get by investing in an index fund.
Although the past week has been more reassuring for shareholders, they're still in the red over the last year, so let's see if the underlying business has been responsible for the decline.
See our latest analysis for Schroders
To quote Buffett, 'Ships will sail around the world but the Flat Earth Society will flourish. There will continue to be wide discrepancies between price and value in the marketplace...' One flawed but reasonable way to assess how sentiment around a company has changed is to compare the earnings per share (EPS) with the share price.
During the unfortunate twelve months during which the Schroders share price fell, it actually saw its earnings per share (EPS) improve by 1.3%. Of course, the situation might betray previous over-optimism about growth.
By glancing at these numbers, we'd posit that the the market had expectations of much higher growth, last year. But other metrics might shed some light on why the share price is down.
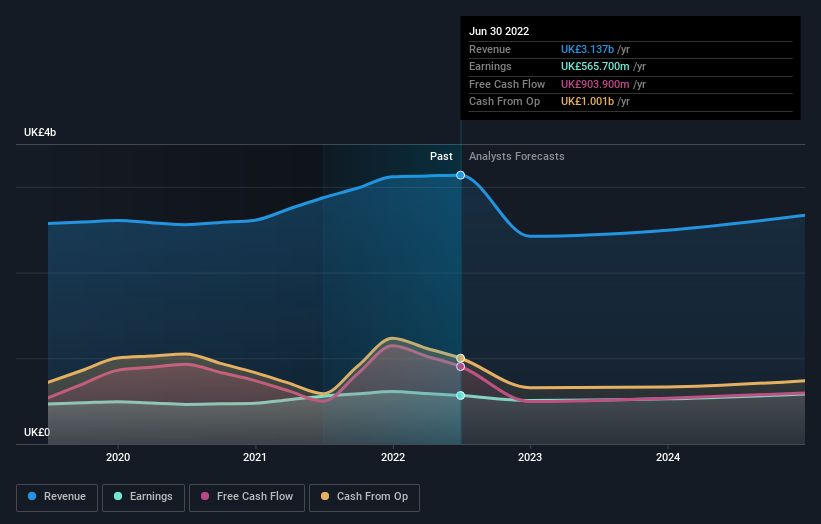
Schroders' dividend seems healthy to us, so we doubt that the yield is a concern for the market. The revenue trend doesn't seem to explain why the share price is down. Of course, it could simply be that it simply fell short of the market consensus expectations.
The company's revenue and earnings (over time) are depicted in the image below (click to see the exact numbers).
Schroders is well known by investors, and plenty of clever analysts have tried to predict the future profit levels. You can see what analysts are predicting for Schroders in this interactive graph of future profit estimates.
What About Dividends?
It is important to consider the total shareholder return, as well as the share price return, for any given stock. The TSR is a return calculation that accounts for the value of cash dividends (assuming that any dividend received was reinvested) and the calculated value of any discounted capital raisings and spin-offs. Arguably, the TSR gives a more comprehensive picture of the return generated by a stock. In the case of Schroders, it has a TSR of -30% for the last 1 year. That exceeds its share price return that we previously mentioned. This is largely a result of its dividend payments!
A Different Perspective
While the broader market lost about 8.9% in the twelve months, Schroders shareholders did even worse, losing 30% (even including dividends). However, it could simply be that the share price has been impacted by broader market jitters. It might be worth keeping an eye on the fundamentals, in case there's a good opportunity. Unfortunately, last year's performance may indicate unresolved challenges, given that it was worse than the annualised loss of 3% over the last half decade. Generally speaking long term share price weakness can be a bad sign, though contrarian investors might want to research the stock in hope of a turnaround. Importantly, we haven't analysed Schroders' dividend history. This free visual report on its dividends is a must-read if you're thinking of buying.
Of course Schroders may not be the best stock to buy. So you may wish to see this free collection of growth stocks.
Please note, the market returns quoted in this article reflect the market weighted average returns of stocks that currently trade on GB exchanges.
Have feedback on this article? Concerned about the content? Get in touch with us directly. Alternatively, email editorial-team (at) simplywallst.com.
This article by Simply Wall St is general in nature. We provide commentary based on historical data and analyst forecasts only using an unbiased methodology and our articles are not intended to be financial advice. It does not constitute a recommendation to buy or sell any stock, and does not take account of your objectives, or your financial situation. We aim to bring you long-term focused analysis driven by fundamental data. Note that our analysis may not factor in the latest price-sensitive company announcements or qualitative material. Simply Wall St has no position in any stocks mentioned.
Join A Paid User Research Session
You’ll receive a US$30 Amazon Gift card for 1 hour of your time while helping us build better investing tools for the individual investors like yourself. Sign up here
