
 Yahoo Finance
 Will S2 Resources (ASX:S2R) Spend Its Cash Wisely?
Even when a business is losing money, it's possible for shareholders to make money if they buy a good business at the right price. For example, although Amazon.com made losses for many years after listing, if you had bought and held the shares since 1999, you would have made a fortune. Having said that, unprofitable companies are risky because they could potentially burn through all their cash and become distressed.
Given this risk, we thought we'd take a look at whether S2 Resources (ASX:S2R) shareholders should be worried about its cash burn. For the purpose of this article, we'll define cash burn as the amount of cash the company is spending each year to fund its growth (also called its negative free cash flow). Let's start with an examination of the business' cash, relative to its cash burn.
Check out our latest analysis for S2 Resources
How Long Is S2 Resources' Cash Runway?
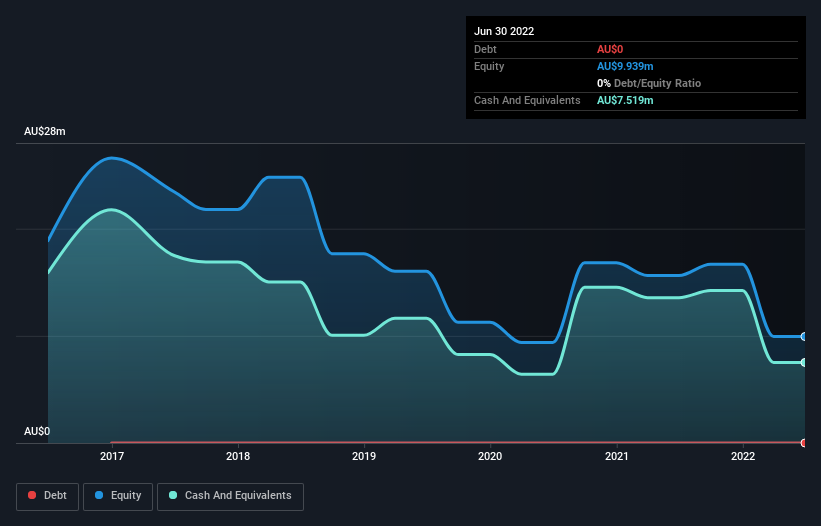
You can calculate a company's cash runway by dividing the amount of cash it has by the rate at which it is spending that cash. As at June 2022, S2 Resources had cash of AU$7.5m and no debt. Looking at the last year, the company burnt through AU$6.6m. That means it had a cash runway of around 14 months as of June 2022. That's not too bad, but it's fair to say the end of the cash runway is in sight, unless cash burn reduces drastically. You can see how its cash balance has changed over time in the image below.
How Is S2 Resources' Cash Burn Changing Over Time?
While S2 Resources did record statutory revenue of AU$167k over the last year, it didn't have any revenue from operations. To us, that makes it a pre-revenue company, so we'll look to its cash burn trajectory as an assessment of its cash burn situation. With the cash burn rate up 11% in the last year, it seems that the company is ratcheting up investment in the business over time. That's not necessarily a bad thing, but investors should be mindful of the fact that will shorten the cash runway. S2 Resources makes us a little nervous due to its lack of substantial operating revenue. We prefer most of the stocks on this list of stocks that analysts expect to grow.
Can S2 Resources Raise More Cash Easily?
Given its cash burn trajectory, S2 Resources shareholders may wish to consider how easily it could raise more cash, despite its solid cash runway. Companies can raise capital through either debt or equity. One of the main advantages held by publicly listed companies is that they can sell shares to investors to raise cash and fund growth. By comparing a company's annual cash burn to its total market capitalisation, we can estimate roughly how many shares it would have to issue in order to run the company for another year (at the same burn rate).
Since it has a market capitalisation of AU$62m, S2 Resources' AU$6.6m in cash burn equates to about 11% of its market value. Given that situation, it's fair to say the company wouldn't have much trouble raising more cash for growth, but shareholders would be somewhat diluted.
How Risky Is S2 Resources' Cash Burn Situation?
On this analysis of S2 Resources' cash burn, we think its cash burn relative to its market cap was reassuring, while its increasing cash burn has us a bit worried. Even though we don't think it has a problem with its cash burn, the analysis we've done in this article does suggest that shareholders should give some careful thought to the potential cost of raising more money in the future. Separately, we looked at different risks affecting the company and spotted 3 warning signs for S2 Resources (of which 2 are potentially serious!) you should know about.
Of course, you might find a fantastic investment by looking elsewhere. So take a peek at this free list of interesting companies, and this list of stocks growth stocks (according to analyst forecasts)
Have feedback on this article? Concerned about the content? Get in touch with us directly. Alternatively, email editorial-team (at) simplywallst.com.
This article by Simply Wall St is general in nature. We provide commentary based on historical data and analyst forecasts only using an unbiased methodology and our articles are not intended to be financial advice. It does not constitute a recommendation to buy or sell any stock, and does not take account of your objectives, or your financial situation. We aim to bring you long-term focused analysis driven by fundamental data. Note that our analysis may not factor in the latest price-sensitive company announcements or qualitative material. Simply Wall St has no position in any stocks mentioned.
Join A Paid User Research Session
You’ll receive a US$30 Amazon Gift card for 1 hour of your time while helping us build better investing tools for the individual investors like yourself. Sign up here
