
 Yahoo Finance
 Is S2 Resources (ASX:S2R) In A Good Position To Invest In Growth?
There's no doubt that money can be made by owning shares of unprofitable businesses. For example, although software-as-a-service business Salesforce.com lost money for years while it grew recurring revenue, if you held shares since 2005, you'd have done very well indeed. But while history lauds those rare successes, those that fail are often forgotten; who remembers Pets.com?
Given this risk, we thought we'd take a look at whether S2 Resources (ASX:S2R) shareholders should be worried about its cash burn. In this report, we will consider the company's annual negative free cash flow, henceforth referring to it as the 'cash burn'. The first step is to compare its cash burn with its cash reserves, to give us its 'cash runway'.
Check out our latest analysis for S2 Resources
How Long Is S2 Resources' Cash Runway?
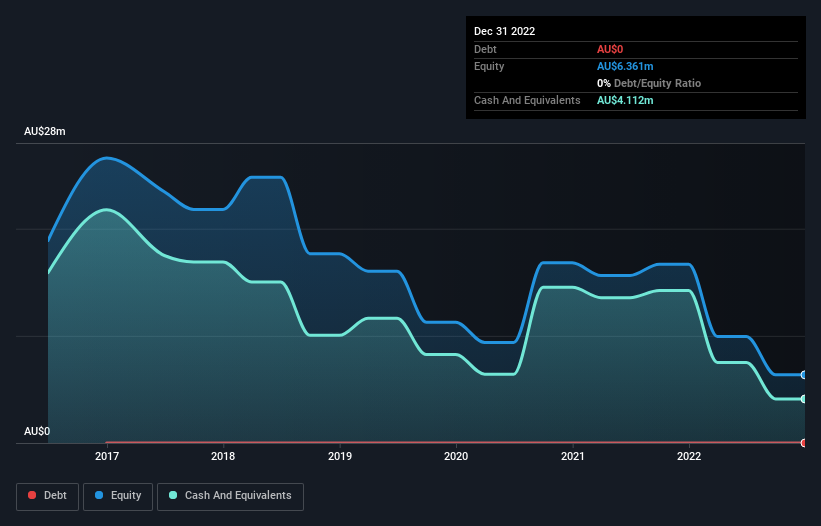
You can calculate a company's cash runway by dividing the amount of cash it has by the rate at which it is spending that cash. When S2 Resources last reported its balance sheet in December 2022, it had zero debt and cash worth AU$4.1m. Importantly, its cash burn was AU$5.5m over the trailing twelve months. Therefore, from December 2022 it had roughly 9 months of cash runway. To be frank, this kind of short runway puts us on edge, as it indicates the company must reduce its cash burn significantly, or else raise cash imminently. Depicted below, you can see how its cash holdings have changed over time.
How Is S2 Resources' Cash Burn Changing Over Time?
Although S2 Resources reported revenue of AU$64k last year, it didn't actually have any revenue from operations. To us, that makes it a pre-revenue company, so we'll look to its cash burn trajectory as an assessment of its cash burn situation. As it happens, the company's cash burn reduced by 23% over the last year, which suggests that management are mindful of the possibility of running out of cash. S2 Resources makes us a little nervous due to its lack of substantial operating revenue. We prefer most of the stocks on this list of stocks that analysts expect to grow.
How Easily Can S2 Resources Raise Cash?
While S2 Resources is showing a solid reduction in its cash burn, it's still worth considering how easily it could raise more cash, even just to fuel faster growth. Issuing new shares, or taking on debt, are the most common ways for a listed company to raise more money for its business. Many companies end up issuing new shares to fund future growth. We can compare a company's cash burn to its market capitalisation to get a sense for how many new shares a company would have to issue to fund one year's operations.
S2 Resources' cash burn of AU$5.5m is about 8.4% of its AU$66m market capitalisation. Given that is a rather small percentage, it would probably be really easy for the company to fund another year's growth by issuing some new shares to investors, or even by taking out a loan.
How Risky Is S2 Resources' Cash Burn Situation?
Even though its cash runway makes us a little nervous, we are compelled to mention that we thought S2 Resources' cash burn relative to its market cap was relatively promising. Even though we don't think it has a problem with its cash burn, the analysis we've done in this article does suggest that shareholders should give some careful thought to the potential cost of raising more money in the future. On another note, S2 Resources has 6 warning signs (and 3 which don't sit too well with us) we think you should know about.
Of course, you might find a fantastic investment by looking elsewhere. So take a peek at this free list of companies insiders are buying, and this list of stocks growth stocks (according to analyst forecasts)
Have feedback on this article? Concerned about the content? Get in touch with us directly. Alternatively, email editorial-team (at) simplywallst.com.
This article by Simply Wall St is general in nature. We provide commentary based on historical data and analyst forecasts only using an unbiased methodology and our articles are not intended to be financial advice. It does not constitute a recommendation to buy or sell any stock, and does not take account of your objectives, or your financial situation. We aim to bring you long-term focused analysis driven by fundamental data. Note that our analysis may not factor in the latest price-sensitive company announcements or qualitative material. Simply Wall St has no position in any stocks mentioned.
Join A Paid User Research Session
You’ll receive a US$30 Amazon Gift card for 1 hour of your time while helping us build better investing tools for the individual investors like yourself. Sign up here
