
 Yahoo Finance
 Royalty Pharma plc's (NASDAQ:RPRX) Fundamentals Look Pretty Strong: Could The Market Be Wrong About The Stock?
It is hard to get excited after looking at Royalty Pharma's (NASDAQ:RPRX) recent performance, when its stock has declined 6.2% over the past month. But if you pay close attention, you might find that its key financial indicators look quite decent, which could mean that the stock could potentially rise in the long-term given how markets usually reward more resilient long-term fundamentals. In this article, we decided to focus on Royalty Pharma's ROE.
Return on equity or ROE is an important factor to be considered by a shareholder because it tells them how effectively their capital is being reinvested. In other words, it is a profitability ratio which measures the rate of return on the capital provided by the company's shareholders.
See our latest analysis for Royalty Pharma
How Do You Calculate Return On Equity?
Return on equity can be calculated by using the formula:
Return on Equity = Net Profit (from continuing operations) ÷ Shareholders' Equity
So, based on the above formula, the ROE for Royalty Pharma is:
12% = US$1.2b ÷ US$10b (Based on the trailing twelve months to March 2022).
The 'return' is the profit over the last twelve months. Another way to think of that is that for every $1 worth of equity, the company was able to earn $0.12 in profit.
What Has ROE Got To Do With Earnings Growth?
So far, we've learned that ROE is a measure of a company's profitability. We now need to evaluate how much profit the company reinvests or "retains" for future growth which then gives us an idea about the growth potential of the company. Assuming everything else remains unchanged, the higher the ROE and profit retention, the higher the growth rate of a company compared to companies that don't necessarily bear these characteristics.
Royalty Pharma's Earnings Growth And 12% ROE
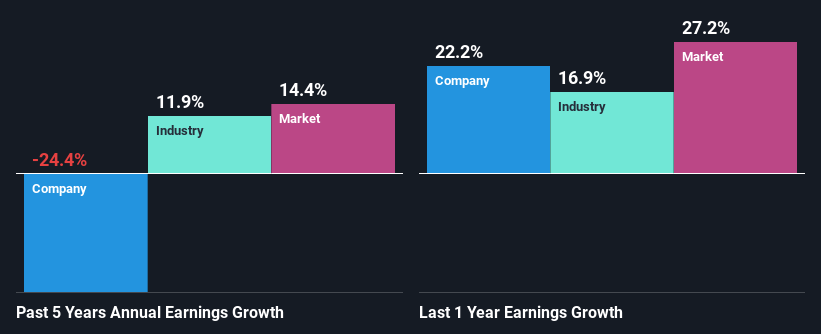
To start with, Royalty Pharma's ROE looks acceptable. Yet, the fact that the company's ROE is lower than the industry average of 18% does temper our expectations. Further research shows that Royalty Pharma's net income has shrunk at a rate of 24% over the last five years. Not to forget, the company does have a high ROE to begin with, just that it is lower than the industry average. So there might be other reasons for the earnings to shrink. For example, it could be that the company has a high payout ratio or the business has allocated capital poorly, for instance.
So, as a next step, we compared Royalty Pharma's performance against the industry and were disappointed to discover that while the company has been shrinking its earnings, the industry has been growing its earnings at a rate of 12% in the same period.
Earnings growth is a huge factor in stock valuation. What investors need to determine next is if the expected earnings growth, or the lack of it, is already built into the share price. Doing so will help them establish if the stock's future looks promising or ominous. One good indicator of expected earnings growth is the P/E ratio which determines the price the market is willing to pay for a stock based on its earnings prospects. So, you may want to check if Royalty Pharma is trading on a high P/E or a low P/E, relative to its industry.
Is Royalty Pharma Making Efficient Use Of Its Profits?
Despite having a normal three-year median payout ratio of 35% (where it is retaining 65% of its profits), Royalty Pharma has seen a decline in earnings as we saw above. It looks like there might be some other reasons to explain the lack in that respect. For example, the business could be in decline.
Only recently, Royalty Pharma stated paying a dividend. This likely means that the management might have concluded that its shareholders have a strong preference for dividends. Our latest analyst data shows that the future payout ratio of the company is expected to drop to 24% over the next three years. The fact that the company's ROE is expected to rise to 26% over the same period is explained by the drop in the payout ratio.
Conclusion
Overall, we feel that Royalty Pharma certainly does have some positive factors to consider. Yet, the low earnings growth is a bit concerning, especially given that the company has a respectable rate of return and is reinvesting a huge portion of its profits. By the looks of it, there could be some other factors, not necessarily in control of the business, that's preventing growth. That being so, the latest industry analyst forecasts show that the analysts are expecting to see a huge improvement in the company's earnings growth rate. To know more about the latest analysts predictions for the company, check out this visualization of analyst forecasts for the company.
Have feedback on this article? Concerned about the content? Get in touch with us directly. Alternatively, email editorial-team (at) simplywallst.com.
This article by Simply Wall St is general in nature. We provide commentary based on historical data and analyst forecasts only using an unbiased methodology and our articles are not intended to be financial advice. It does not constitute a recommendation to buy or sell any stock, and does not take account of your objectives, or your financial situation. We aim to bring you long-term focused analysis driven by fundamental data. Note that our analysis may not factor in the latest price-sensitive company announcements or qualitative material. Simply Wall St has no position in any stocks mentioned.
