
 Yahoo Finance
 Is Royal Gold (NASDAQ:RGLD) A Risky Investment?

The external fund manager backed by Berkshire Hathaway's Charlie Munger, Li Lu, makes no bones about it when he says 'The biggest investment risk is not the volatility of prices, but whether you will suffer a permanent loss of capital. It's only natural to consider a company's balance sheet when you examine how risky it is, since debt is often involved when a business collapses. We note that Royal Gold, Inc. (NASDAQ:RGLD) does have debt on its balance sheet. But the real question is whether this debt is making the company risky.
When Is Debt A Problem?
Generally speaking, debt only becomes a real problem when a company can't easily pay it off, either by raising capital or with its own cash flow. If things get really bad, the lenders can take control of the business. While that is not too common, we often do see indebted companies permanently diluting shareholders because lenders force them to raise capital at a distressed price. By replacing dilution, though, debt can be an extremely good tool for businesses that need capital to invest in growth at high rates of return. The first thing to do when considering how much debt a business uses is to look at its cash and debt together.
Check out our latest analysis for Royal Gold
How Much Debt Does Royal Gold Carry?
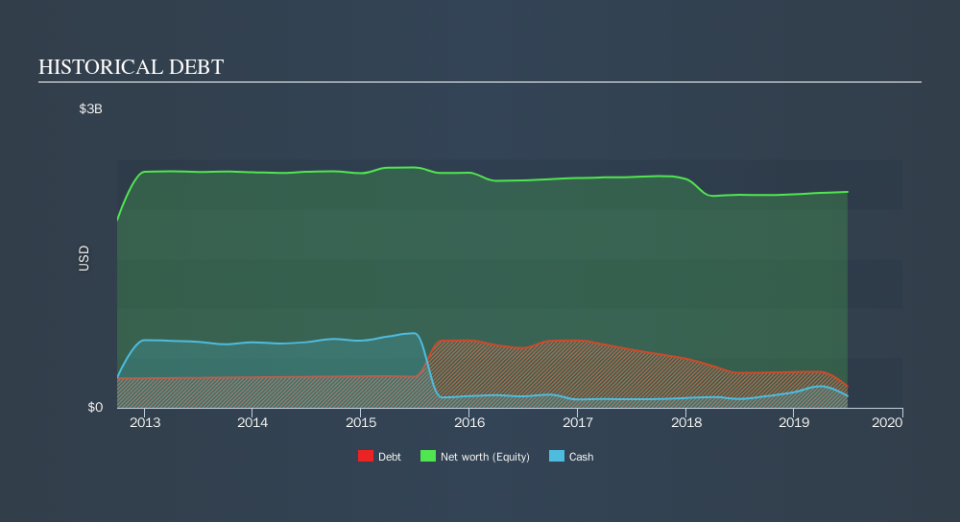
You can click the graphic below for the historical numbers, but it shows that Royal Gold had US$214.6m of debt in June 2019, down from US$351.0m, one year before. However, it also had US$119.5m in cash, and so its net debt is US$95.1m.
How Strong Is Royal Gold's Balance Sheet?
The latest balance sheet data shows that Royal Gold had liabilities of US$33.6m due within a year, and liabilities of US$340.1m falling due after that. On the other hand, it had cash of US$119.5m and US$23.4m worth of receivables due within a year. So its liabilities total US$230.8m more than the combination of its cash and short-term receivables.
Given Royal Gold has a market capitalization of US$8.52b, it's hard to believe these liabilities pose much threat. But there are sufficient liabilities that we would certainly recommend shareholders continue to monitor the balance sheet, going forward. But either way, Royal Gold has virtually no net debt, so it's fair to say it does not have a heavy debt load!
We use two main ratios to inform us about debt levels relative to earnings. The first is net debt divided by earnings before interest, tax, depreciation, and amortization (EBITDA), while the second is how many times its earnings before interest and tax (EBIT) covers its interest expense (or its interest cover, for short). The advantage of this approach is that we take into account both the absolute quantum of debt (with net debt to EBITDA) and the actual interest expenses associated with that debt (with its interest cover ratio).
Looking at its net debt to EBITDA of 0.31 and interest cover of 5.9 times, it seems to us that Royal Gold is probably using debt in a pretty reasonable way. So we'd recommend keeping a close eye on the impact financing costs are having on the business. Although Royal Gold made a loss at the EBIT level, last year, it was also good to see that it generated US$141m in EBIT over the last twelve months. When analysing debt levels, the balance sheet is the obvious place to start. But it is future earnings, more than anything, that will determine Royal Gold's ability to maintain a healthy balance sheet going forward. So if you want to see what the professionals think, you might find this free report on analyst profit forecasts to be interesting.
Finally, a business needs free cash flow to pay off debt; accounting profits just don't cut it. So it is important to check how much of its earnings before interest and tax (EBIT) converts to actual free cash flow. Happily for any shareholders, Royal Gold actually produced more free cash flow than EBIT over the last year. That sort of strong cash conversion gets us as excited as the crowd when the beat drops at a Daft Punk concert.
Our View
Royal Gold's conversion of EBIT to free cash flow suggests it can handle its debt as easily as Cristiano Ronaldo could score a goal against an under 14's goalkeeper. And the good news does not stop there, as its net debt to EBITDA also supports that impression! Looking at the bigger picture, we think Royal Gold's use of debt seems quite reasonable and we're not concerned about it. While debt does bring risk, when used wisely it can also bring a higher return on equity. Of course, we wouldn't say no to the extra confidence that we'd gain if we knew that Royal Gold insiders have been buying shares: if you're on the same wavelength, you can find out if insiders are buying by clicking this link.
If, after all that, you're more interested in a fast growing company with a rock-solid balance sheet, then check out our list of net cash growth stocks without delay.
We aim to bring you long-term focused research analysis driven by fundamental data. Note that our analysis may not factor in the latest price-sensitive company announcements or qualitative material.
If you spot an error that warrants correction, please contact the editor at editorial-team@simplywallst.com. This article by Simply Wall St is general in nature. It does not constitute a recommendation to buy or sell any stock, and does not take account of your objectives, or your financial situation. Simply Wall St has no position in the stocks mentioned. Thank you for reading.
