
 Yahoo Finance
 Should Royal Caribbean Cruises (NYSE:RCL) Be Disappointed With Their 87% Profit?

Stock pickers are generally looking for stocks that will outperform the broader market. And the truth is, you can make significant gains if you buy good quality businesses at the right price. For example, long term Royal Caribbean Cruises Ltd. (NYSE:RCL) shareholders have enjoyed a 87% share price rise over the last half decade, well in excess of the market return of around 45% (not including dividends). On the other hand, the more recent gains haven't been so impressive, with shareholders gaining just 6.6%, including dividends.
Check out our latest analysis for Royal Caribbean Cruises
While the efficient markets hypothesis continues to be taught by some, it has been proven that markets are over-reactive dynamic systems, and investors are not always rational. One imperfect but simple way to consider how the market perception of a company has shifted is to compare the change in the earnings per share (EPS) with the share price movement.
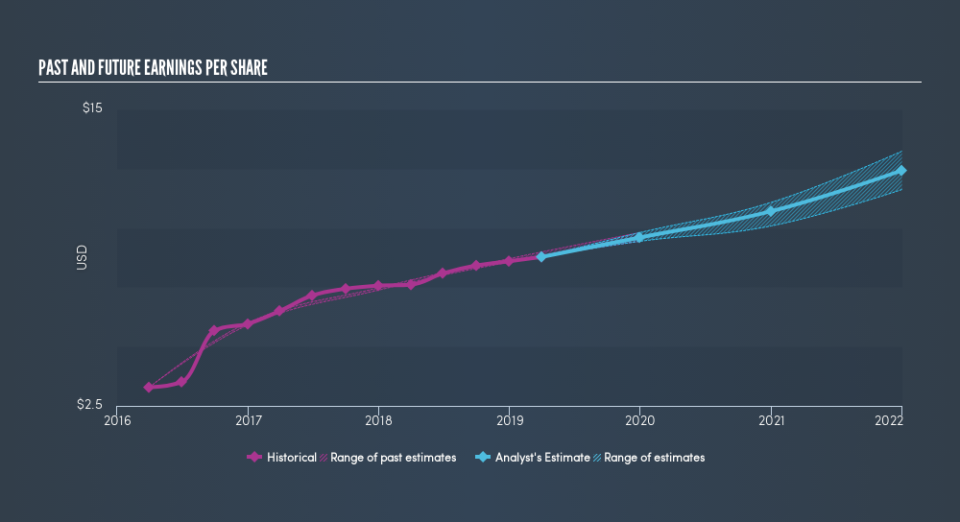
Over half a decade, Royal Caribbean Cruises managed to grow its earnings per share at 35% a year. The EPS growth is more impressive than the yearly share price gain of 13% over the same period. Therefore, it seems the market has become relatively pessimistic about the company.
You can see how EPS has changed over time in the image below (click on the chart to see the exact values).
We like that insiders have been buying shares in the last twelve months. Even so, future earnings will be far more important to whether current shareholders make money. Before buying or selling a stock, we always recommend a close examination of historic growth trends, available here..
What About Dividends?
When looking at investment returns, it is important to consider the difference between total shareholder return (TSR) and share price return. The TSR incorporates the value of any spin-offs or discounted capital raisings, along with any dividends, based on the assumption that the dividends are reinvested. Arguably, the TSR gives a more comprehensive picture of the return generated by a stock. In the case of Royal Caribbean Cruises, it has a TSR of 106% for the last 5 years. That exceeds its share price return that we previously mentioned. This is largely a result of its dividend payments!
A Different Perspective
Royal Caribbean Cruises's TSR for the year was broadly in line with the market average, at 6.6%. It has to be noted that the recent return falls short of the 16% shareholders have gained each year, over half a decade. More recently, the share price growth has slowed. But it has to be said the overall picture is one of good long term and short term performance. Arguably that makes Royal Caribbean Cruises a stock worth watching. If you want to research this stock further, the data on insider buying is an obvious place to start. You can click here to see who has been buying shares - and the price they paid.
If you like to buy stocks alongside management, then you might just love this free list of companies. (Hint: insiders have been buying them).
Please note, the market returns quoted in this article reflect the market weighted average returns of stocks that currently trade on US exchanges.
We aim to bring you long-term focused research analysis driven by fundamental data. Note that our analysis may not factor in the latest price-sensitive company announcements or qualitative material.
If you spot an error that warrants correction, please contact the editor at editorial-team@simplywallst.com. This article by Simply Wall St is general in nature. It does not constitute a recommendation to buy or sell any stock, and does not take account of your objectives, or your financial situation. Simply Wall St has no position in the stocks mentioned. Thank you for reading.
