
 Yahoo Finance
 Ross Stores (ROST) Q1 Earnings & Sales Beat Estimates, Up Y/Y
Ross Stores, Inc.’s ROST top and bottom lines beat the Zacks Consensus Estimate in the first quarter of fiscal 2024. Both metrics improved year over year. The strong results, which can be attributed to customers' favorable response to quality and branded bargains, lead to impressive earnings growth.
Consequently, this Zacks Rank #3 (Hold) company’s shares have rallied 30.3% in the past year compared with the industry's 36.3% growth.
Q1 Insights
Ross Stores’ earnings of $1.46 per share beat the Zacks Consensus Estimate of $1.34. Earnings also improved 33.9% from $1.09 per share reported in the fourth quarter of fiscal 2023
Total sales of $4,858.1 million rose 8% year over year and surpassed the consensus estimate of $4,827 million. The sales improvement mainly stemmed from strong comparable store sales (comps) performance. Comps improved 3%, mainly due to higher customer traffic and a favorable reaction from shoppers toward the enhanced assortments across its stores.
Ross Stores, Inc. Price, Consensus and EPS Surprise
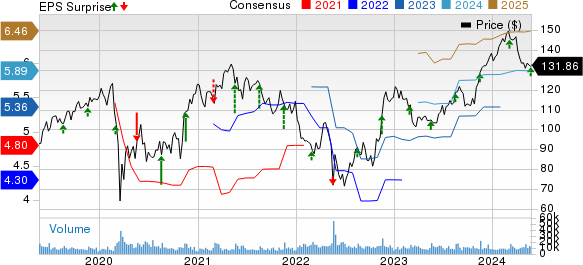
Ross Stores, Inc. price-consensus-eps-surprise-chart | Ross Stores, Inc. Quote
The cost of goods sold (COGS) was $3,490.7 million, which increased 6% year over year and exceeded our estimate of $3,462.5 million. As a percentage of sales, COGS was 71.9%, marking a year-over-year decrease of 140 basis points (bps). Our model had estimated a 130-bps decline in the COGS rate to 73.7%. Distribution costs declined 75 bps while buying improved by 50 bps. Further, domestic freight fell 30 bps and merchandise margin dipped 15 bps as pressure from higher sharply-priced brands was somewhat offset by a fall in ocean freight costs.
Selling, general and administrative (SG&A) expenses of $776.3 million increased 4% year over year and were lower than our estimate of $805.1 million. SG&A, as a percentage of sales, fell 65 bps year over year to 16%. We had estimated the SG&A rate to be 16.8%, indicating a 20-bps increase year over year. The decrease in the SG&A rate was mainly because of lower incentive costs and higher sales. The operating margin of 12.2% grew 205 bps year over year.
Our model had predicted an operating margin of 11.2%, suggesting 110 bps growth from last year.
Financials
Ross Stores ended first-quarter fiscal 2024 with cash and cash equivalents of $4.7 billion, long-term debt of $1.5 billion and total shareholders’ equity of $4.9 billion.
During the first quarter, the company repurchased 1.9 million shares of common stock for $262 million under its new two-year $2.1 billion authorization. The company is on track to buy back a total of $1.05 billion in fiscal 2024. As of May 4, Ross Stores operated a total of 2,127 stores.
Outlook
Moving ahead, management highlighted that the ongoing uncertainty in the macroeconomic and geopolitical backdrop, comprising inflation, continues to lower low-to-moderate income customers’ purchasing power. The company continues to manage inventory and expenses tightly to boost sales and earnings growth for the rest of the fiscal year.
For the 13 weeks ending Aug 3, 2024, comps are likely to rise in the band of 2-3% year over year. Earnings per share for the second quarter are envisioned to be in the range of $1.43-$1.49, higher than earnings per share of $1.32 reported in the year-earlier quarter. Operating margin is likely to be in the 11.5-11.8% range compared with 11.3% in the year-earlier period.
Further, comps for the 52 weeks ending Feb 1, 2025, are still anticipated to be up in the band of 2-3%, with earnings per share in the range of $5.79-$5.98 compared with $5.56 for the 53 weeks ended Feb 3, 2024.
Key Picks
We have highlighted three better-ranked stocks, namely Gap GPS, American Eagle AEO and Deckers DECK.
Gap, a leading apparel retailer, currently sports a Zacks Rank #1 (Strong Buy). GPS delivered an earnings surprise of 180.9% in the trailing four quarters. You can see the complete list of today’s Zacks #1 Rank stocks here.
The Zacks Consensus Estimate for Gap’s financial-year sales suggests growth of 1.7% from the year-ago reported figure.
American Eagle, a casual apparel retailer, currently carries a Zacks Rank #2 (Buy). AEO delivered an earnings surprise of 22% in the last reported quarter.
The consensus estimate for American Eagle’s current financial-year sales suggests growth of 3.4% from the year-ago reported figure.
Deckers, a footwear and accessories dealer, currently carries a Zacks Rank of 2. DECK delivered an earnings surprise of 32.1% in the trailing four quarters.
The Zacks Consensus Estimate for Deckers’ current financial-year sales suggests growth of 15.8% from the year-ago reported figure.
Want the latest recommendations from Zacks Investment Research? Today, you can download 7 Best Stocks for the Next 30 Days. Click to get this free report
American Eagle Outfitters, Inc. (AEO) : Free Stock Analysis Report
Deckers Outdoor Corporation (DECK) : Free Stock Analysis Report
The Gap, Inc. (GPS) : Free Stock Analysis Report
Ross Stores, Inc. (ROST) : Free Stock Analysis Report
