
 Yahoo Finance
 Will The ROCE Trend At Orbital (ASX:OEC) Continue?
There are a few key trends to look for if we want to identify the next multi-bagger. Firstly, we'll want to see a proven return on capital employed (ROCE) that is increasing, and secondly, an expanding base of capital employed. Put simply, these types of businesses are compounding machines, meaning they are continually reinvesting their earnings at ever-higher rates of return. With that in mind, we've noticed some promising trends at Orbital (ASX:OEC) so let's look a bit deeper.
What is Return On Capital Employed (ROCE)?
Just to clarify if you're unsure, ROCE is a metric for evaluating how much pre-tax income (in percentage terms) a company earns on the capital invested in its business. Analysts use this formula to calculate it for Orbital:
Return on Capital Employed = Earnings Before Interest and Tax (EBIT) ÷ (Total Assets - Current Liabilities)
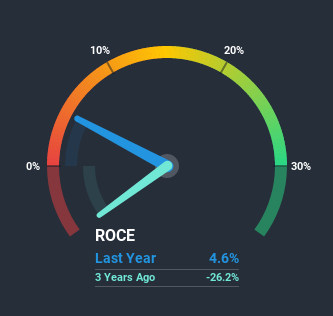
0.046 = AU$996k ÷ (AU$36m - AU$15m) (Based on the trailing twelve months to December 2020).
So, Orbital has an ROCE of 4.6%. In absolute terms, that's a low return and it also under-performs the Aerospace & Defense industry average of 8.2%.
Check out our latest analysis for Orbital
In the above chart we have measured Orbital's prior ROCE against its prior performance, but the future is arguably more important. If you're interested, you can view the analysts predictions in our free report on analyst forecasts for the company.
What The Trend Of ROCE Can Tell Us
It's great to see that Orbital has started to generate some pre-tax earnings from prior investments. Historically the company was generating losses but as we can see from the latest figures referenced above, they're now earning 4.6% on their capital employed. Additionally, the business is utilizing 50% less capital than it was five years ago, and taken at face value, that can mean the company needs less funds at work to get a return. The reduction could indicate that the company is selling some assets, and considering returns are up, they appear to be selling the right ones.
On a side note, we noticed that the improvement in ROCE appears to be partly fueled by an increase in current liabilities. The current liabilities has increased to 41% of total assets, so the business is now more funded by the likes of its suppliers or short-term creditors. Given it's pretty high ratio, we'd remind investors that having current liabilities at those levels can bring about some risks in certain businesses.
Our Take On Orbital's ROCE
In the end, Orbital has proven it's capital allocation skills are good with those higher returns from less amount of capital. Investors may not be impressed by the favorable underlying trends yet because over the last five years the stock has only returned 26% to shareholders. So with that in mind, we think the stock deserves further research.
Since virtually every company faces some risks, it's worth knowing what they are, and we've spotted 4 warning signs for Orbital (of which 1 doesn't sit too well with us!) that you should know about.
While Orbital isn't earning the highest return, check out this free list of companies that are earning high returns on equity with solid balance sheets.
This article by Simply Wall St is general in nature. It does not constitute a recommendation to buy or sell any stock, and does not take account of your objectives, or your financial situation. We aim to bring you long-term focused analysis driven by fundamental data. Note that our analysis may not factor in the latest price-sensitive company announcements or qualitative material. Simply Wall St has no position in any stocks mentioned.
Have feedback on this article? Concerned about the content? Get in touch with us directly. Alternatively, email editorial-team (at) simplywallst.com.
