
 Yahoo Finance
 Are Robust Financials Driving The Recent Rally In Image Resources NL's (ASX:IMA) Stock?
Image Resources' (ASX:IMA) stock is up by a considerable 33% over the past three months. Since the market usually pay for a company’s long-term fundamentals, we decided to study the company’s key performance indicators to see if they could be influencing the market. Specifically, we decided to study Image Resources' ROE in this article.
Return on equity or ROE is a key measure used to assess how efficiently a company's management is utilizing the company's capital. In other words, it is a profitability ratio which measures the rate of return on the capital provided by the company's shareholders.
Check out our latest analysis for Image Resources
How Do You Calculate Return On Equity?
The formula for ROE is:
Return on Equity = Net Profit (from continuing operations) ÷ Shareholders' Equity
So, based on the above formula, the ROE for Image Resources is:
29% = AU$28m ÷ AU$96m (Based on the trailing twelve months to June 2020).
The 'return' is the yearly profit. One way to conceptualize this is that for each A$1 of shareholders' capital it has, the company made A$0.29 in profit.
What Has ROE Got To Do With Earnings Growth?
So far, we've learned that ROE is a measure of a company's profitability. Depending on how much of these profits the company reinvests or "retains", and how effectively it does so, we are then able to assess a company’s earnings growth potential. Assuming all else is equal, companies that have both a higher return on equity and higher profit retention are usually the ones that have a higher growth rate when compared to companies that don't have the same features.
A Side By Side comparison of Image Resources' Earnings Growth And 29% ROE
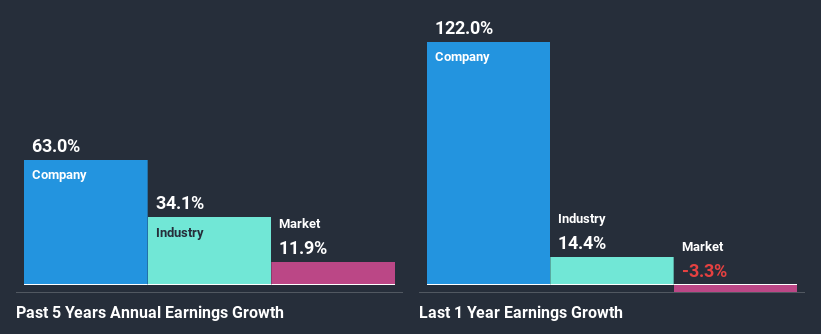
To begin with, Image Resources has a pretty high ROE which is interesting. Secondly, even when compared to the industry average of 13% the company's ROE is quite impressive. So, the substantial 63% net income growth seen by Image Resources over the past five years isn't overly surprising.
We then compared Image Resources' net income growth with the industry and we're pleased to see that the company's growth figure is higher when compared with the industry which has a growth rate of 34% in the same period.
Earnings growth is a huge factor in stock valuation. It’s important for an investor to know whether the market has priced in the company's expected earnings growth (or decline). By doing so, they will have an idea if the stock is headed into clear blue waters or if swampy waters await. Is Image Resources fairly valued compared to other companies? These 3 valuation measures might help you decide.
Is Image Resources Using Its Retained Earnings Effectively?
Image Resources doesn't pay any dividend currently which essentially means that it has been reinvesting all of its profits into the business. This definitely contributes to the high earnings growth number that we discussed above.
Conclusion
On the whole, we feel that Image Resources' performance has been quite good. In particular, it's great to see that the company is investing heavily into its business and along with a high rate of return, that has resulted in a sizeable growth in its earnings. Having said that, the company's earnings growth is expected to slow down, as forecasted in the current analyst estimates. To know more about the company's future earnings growth forecasts take a look at this free report on analyst forecasts for the company to find out more.
This article by Simply Wall St is general in nature. It does not constitute a recommendation to buy or sell any stock, and does not take account of your objectives, or your financial situation. We aim to bring you long-term focused analysis driven by fundamental data. Note that our analysis may not factor in the latest price-sensitive company announcements or qualitative material. Simply Wall St has no position in any stocks mentioned.
Have feedback on this article? Concerned about the content? Get in touch with us directly. Alternatively, email editorial-team@simplywallst.com.
