
 Yahoo Finance
 Are Robust Financials Driving The Recent Rally In Redbubble Limited's (ASX:RBL) Stock?
Redbubble (ASX:RBL) has had a great run on the share market with its stock up by a significant 30% over the last three months. Given the company's impressive performance, we decided to study its financial indicators more closely as a company's financial health over the long-term usually dictates market outcomes. Particularly, we will be paying attention to Redbubble's ROE today.
Return on equity or ROE is a key measure used to assess how efficiently a company's management is utilizing the company's capital. In simpler terms, it measures the profitability of a company in relation to shareholder's equity.
Check out our latest analysis for Redbubble
How Is ROE Calculated?
The formula for return on equity is:
Return on Equity = Net Profit (from continuing operations) ÷ Shareholders' Equity
So, based on the above formula, the ROE for Redbubble is:
27% = AU$31m ÷ AU$116m (Based on the trailing twelve months to June 2021).
The 'return' is the income the business earned over the last year. Another way to think of that is that for every A$1 worth of equity, the company was able to earn A$0.27 in profit.
What Has ROE Got To Do With Earnings Growth?
Thus far, we have learned that ROE measures how efficiently a company is generating its profits. Based on how much of its profits the company chooses to reinvest or "retain", we are then able to evaluate a company's future ability to generate profits. Generally speaking, other things being equal, firms with a high return on equity and profit retention, have a higher growth rate than firms that don’t share these attributes.
A Side By Side comparison of Redbubble's Earnings Growth And 27% ROE
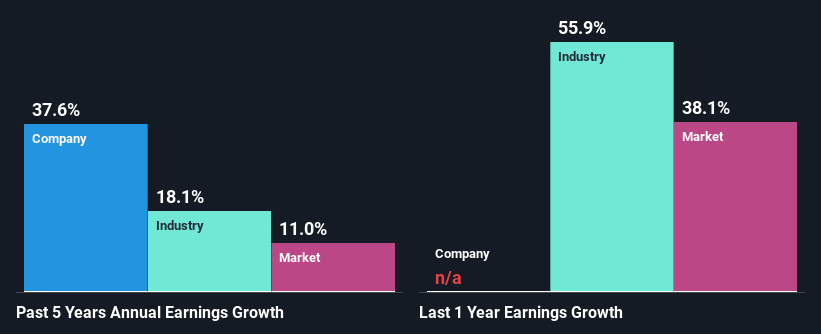
To begin with, Redbubble has a pretty high ROE which is interesting. Additionally, the company's ROE is higher compared to the industry average of 17% which is quite remarkable. So, the substantial 38% net income growth seen by Redbubble over the past five years isn't overly surprising.
Next, on comparing with the industry net income growth, we found that Redbubble's reported growth was lower than the industry growth of 56% in the same period, which is not something we like to see.
The basis for attaching value to a company is, to a great extent, tied to its earnings growth. The investor should try to establish if the expected growth or decline in earnings, whichever the case may be, is priced in. By doing so, they will have an idea if the stock is headed into clear blue waters or if swampy waters await. Has the market priced in the future outlook for RBL? You can find out in our latest intrinsic value infographic research report.
Is Redbubble Using Its Retained Earnings Effectively?
Redbubble doesn't pay any dividend to its shareholders, meaning that the company has been reinvesting all of its profits into the business. This is likely what's driving the high earnings growth number discussed above.
Summary
On the whole, we feel that Redbubble's performance has been quite good. Particularly, we like that the company is reinvesting heavily into its business, and at a high rate of return. As a result, the decent growth in its earnings is not surprising. With that said, the latest industry analyst forecasts reveal that the company's earnings growth is expected to slow down. To know more about the latest analysts predictions for the company, check out this visualization of analyst forecasts for the company.
This article by Simply Wall St is general in nature. We provide commentary based on historical data and analyst forecasts only using an unbiased methodology and our articles are not intended to be financial advice. It does not constitute a recommendation to buy or sell any stock, and does not take account of your objectives, or your financial situation. We aim to bring you long-term focused analysis driven by fundamental data. Note that our analysis may not factor in the latest price-sensitive company announcements or qualitative material. Simply Wall St has no position in any stocks mentioned.
Have feedback on this article? Concerned about the content? Get in touch with us directly. Alternatively, email editorial-team (at) simplywallst.com.
