
 Yahoo Finance
 Is Ridley Corporation Limited's (ASX:RIC) Capital Allocation Ability Worth Your Time?

Today we are going to look at Ridley Corporation Limited (ASX:RIC) to see whether it might be an attractive investment prospect. Specifically, we'll consider its Return On Capital Employed (ROCE), since that will give us an insight into how efficiently the business can generate profits from the capital it requires.
First up, we'll look at what ROCE is and how we calculate it. Then we'll compare its ROCE to similar companies. And finally, we'll look at how its current liabilities are impacting its ROCE.
Return On Capital Employed (ROCE): What is it?
ROCE measures the amount of pre-tax profits a company can generate from the capital employed in its business. In general, businesses with a higher ROCE are usually better quality. In brief, it is a useful tool, but it is not without drawbacks. Author Edwin Whiting says to be careful when comparing the ROCE of different businesses, since 'No two businesses are exactly alike.'
So, How Do We Calculate ROCE?
The formula for calculating the return on capital employed is:
Return on Capital Employed = Earnings Before Interest and Tax (EBIT) ÷ (Total Assets - Current Liabilities)
Or for Ridley:
0.08 = AU$30m ÷ (AU$547m - AU$171m) (Based on the trailing twelve months to December 2018.)
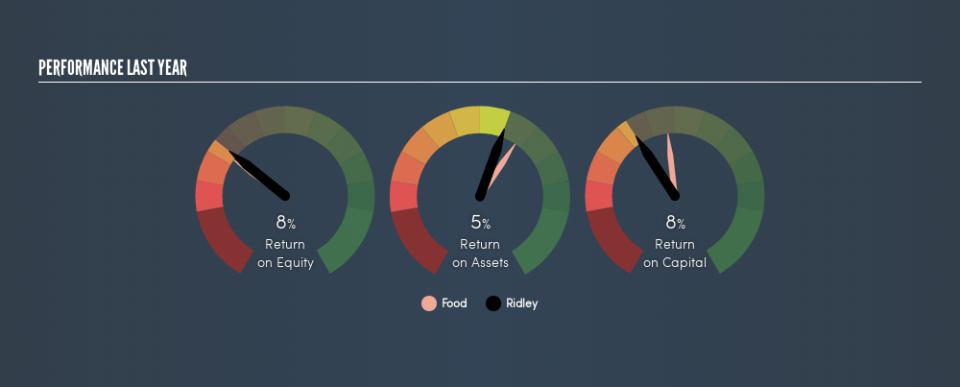
So, Ridley has an ROCE of 8.0%.
Check out our latest analysis for Ridley
Does Ridley Have A Good ROCE?
ROCE is commonly used for comparing the performance of similar businesses. It appears that Ridley's ROCE is fairly close to the Food industry average of 8.7%. Aside from the industry comparison, Ridley's ROCE is mediocre in absolute terms, considering the risk of investing in stocks versus the safety of a bank account. Readers may find more attractive investment prospects elsewhere.
Ridley's current ROCE of 8.0% is lower than its ROCE in the past, which was 11%, 3 years ago. Therefore we wonder if the company is facing new headwinds. You can see in the image below how Ridley's ROCE compares to its industry. Click to see more on past growth.
When considering this metric, keep in mind that it is backwards looking, and not necessarily predictive. Companies in cyclical industries can be difficult to understand using ROCE, as returns typically look high during boom times, and low during busts. ROCE is only a point-in-time measure. Future performance is what matters, and you can see analyst predictions in our free report on analyst forecasts for the company.
How Ridley's Current Liabilities Impact Its ROCE
Current liabilities include invoices, such as supplier payments, short-term debt, or a tax bill, that need to be paid within 12 months. Due to the way ROCE is calculated, a high level of current liabilities makes a company look as though it has less capital employed, and thus can (sometimes unfairly) boost the ROCE. To counter this, investors can check if a company has high current liabilities relative to total assets.
Ridley has total assets of AU$547m and current liabilities of AU$171m. As a result, its current liabilities are equal to approximately 31% of its total assets. Ridley's ROCE is improved somewhat by its moderate amount of current liabilities.
The Bottom Line On Ridley's ROCE
With this level of liabilities and a mediocre ROCE, there are potentially better investments out there. Of course, you might also be able to find a better stock than Ridley. So you may wish to see this free collection of other companies that have grown earnings strongly.
If you are like me, then you will not want to miss this free list of growing companies that insiders are buying.
We aim to bring you long-term focused research analysis driven by fundamental data. Note that our analysis may not factor in the latest price-sensitive company announcements or qualitative material.
If you spot an error that warrants correction, please contact the editor at editorial-team@simplywallst.com. This article by Simply Wall St is general in nature. It does not constitute a recommendation to buy or sell any stock, and does not take account of your objectives, or your financial situation. Simply Wall St has no position in the stocks mentioned. Thank you for reading.
