
 Yahoo Finance
 Ridley Corporation Limited's (ASX:RIC) Has Had A Decent Run On The Stock market: Are Fundamentals In The Driver's Seat?
Ridley's (ASX:RIC) stock is up by 9.7% over the past three months. Given that stock prices are usually aligned with a company's financial performance in the long-term, we decided to investigate if the company's decent financials had a hand to play in the recent price move. Specifically, we decided to study Ridley's ROE in this article.
ROE or return on equity is a useful tool to assess how effectively a company can generate returns on the investment it received from its shareholders. In short, ROE shows the profit each dollar generates with respect to its shareholder investments.
Check out our latest analysis for Ridley
How Is ROE Calculated?
Return on equity can be calculated by using the formula:
Return on Equity = Net Profit (from continuing operations) ÷ Shareholders' Equity
So, based on the above formula, the ROE for Ridley is:
12% = AU$37m ÷ AU$306m (Based on the trailing twelve months to December 2021).
The 'return' is the yearly profit. So, this means that for every A$1 of its shareholder's investments, the company generates a profit of A$0.12.
What Is The Relationship Between ROE And Earnings Growth?
So far, we've learned that ROE is a measure of a company's profitability. We now need to evaluate how much profit the company reinvests or "retains" for future growth which then gives us an idea about the growth potential of the company. Assuming all else is equal, companies that have both a higher return on equity and higher profit retention are usually the ones that have a higher growth rate when compared to companies that don't have the same features.
Ridley's Earnings Growth And 12% ROE
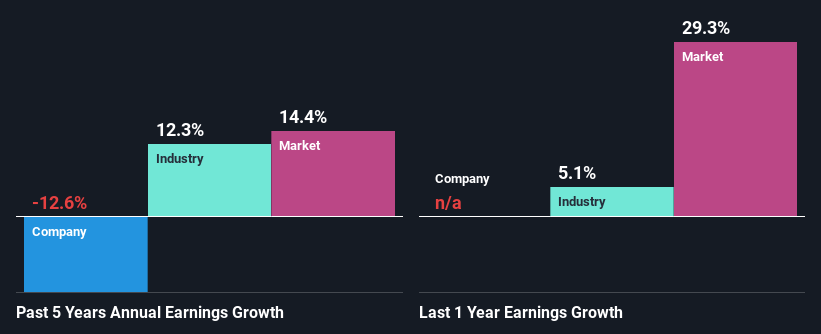
At first glance, Ridley seems to have a decent ROE. Especially when compared to the industry average of 8.1% the company's ROE looks pretty impressive. As you might expect, the 13% net income decline reported by Ridley is a bit of a surprise. We reckon that there could be some other factors at play here that are preventing the company's growth. For example, it could be that the company has a high payout ratio or the business has allocated capital poorly, for instance.
So, as a next step, we compared Ridley's performance against the industry and were disappointed to discover that while the company has been shrinking its earnings, the industry has been growing its earnings at a rate of 12% in the same period.
The basis for attaching value to a company is, to a great extent, tied to its earnings growth. The investor should try to establish if the expected growth or decline in earnings, whichever the case may be, is priced in. Doing so will help them establish if the stock's future looks promising or ominous. Is Ridley fairly valued compared to other companies? These 3 valuation measures might help you decide.
Is Ridley Efficiently Re-investing Its Profits?
Looking at its three-year median payout ratio of 38% (or a retention ratio of 62%) which is pretty normal, Ridley's declining earnings is rather baffling as one would expect to see a fair bit of growth when a company is retaining a good portion of its profits. It looks like there might be some other reasons to explain the lack in that respect. For example, the business could be in decline.
In addition, Ridley has been paying dividends over a period of at least ten years suggesting that keeping up dividend payments is way more important to the management even if it comes at the cost of business growth. Our latest analyst data shows that the future payout ratio of the company is expected to rise to 62% over the next three years. However, the company's ROE is not expected to change by much despite the higher expected payout ratio.
Conclusion
On the whole, we do feel that Ridley has some positive attributes. However, given the high ROE and high profit retention, we would expect the company to be delivering strong earnings growth, but that isn't the case here. This suggests that there might be some external threat to the business, that's hampering its growth. With that said, we studied the latest analyst forecasts and found that while the company has shrunk its earnings in the past, analysts expect its earnings to grow in the future. To know more about the latest analysts predictions for the company, check out this visualization of analyst forecasts for the company.
Have feedback on this article? Concerned about the content? Get in touch with us directly. Alternatively, email editorial-team (at) simplywallst.com.
This article by Simply Wall St is general in nature. We provide commentary based on historical data and analyst forecasts only using an unbiased methodology and our articles are not intended to be financial advice. It does not constitute a recommendation to buy or sell any stock, and does not take account of your objectives, or your financial situation. We aim to bring you long-term focused analysis driven by fundamental data. Note that our analysis may not factor in the latest price-sensitive company announcements or qualitative material. Simply Wall St has no position in any stocks mentioned.
