
 Yahoo Finance
 Is Ridley Corporation Limited (ASX:RIC) A Good Dividend Stock?

Could Ridley Corporation Limited (ASX:RIC) be an attractive dividend share to own for the long haul? Investors are often drawn to strong companies with the idea of reinvesting the dividends. Yet sometimes, investors buy a stock for its dividend and lose money because the share price falls by more than they earned in dividend payments.
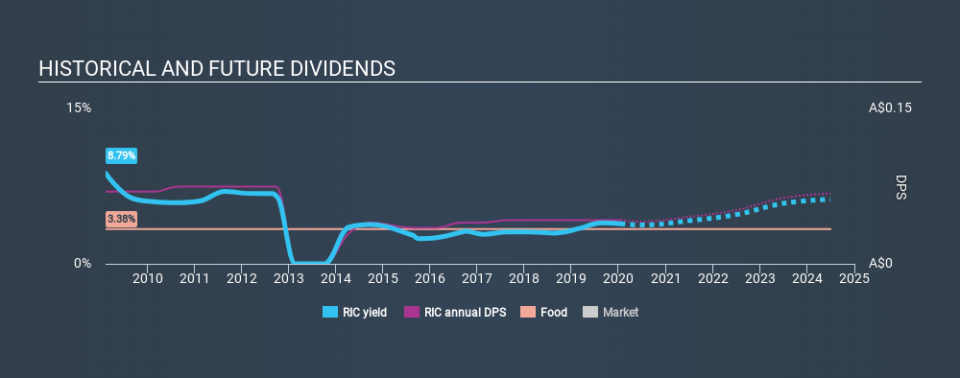
With Ridley yielding 3.9% and having paid a dividend for over 10 years, many investors likely find the company quite interesting. It would not be a surprise to discover that many investors buy it for the dividends. Some simple research can reduce the risk of buying Ridley for its dividend - read on to learn more.
Click the interactive chart for our full dividend analysis
Payout ratios
Dividends are typically paid from company earnings. If a company pays more in dividends than it earned, then the dividend might become unsustainable - hardly an ideal situation. Comparing dividend payments to a company's net profit after tax is a simple way of reality-checking whether a dividend is sustainable. Looking at the data, we can see that 56% of Ridley's profits were paid out as dividends in the last 12 months. A payout ratio above 50% generally implies a business is reaching maturity, although it is still possible to reinvest in the business or increase the dividend over time.
We also measure dividends paid against a company's levered free cash flow, to see if enough cash was generated to cover the dividend. Last year, Ridley paid a dividend while reporting negative free cash flow. While there may be an explanation, we think this behaviour is generally not sustainable.
Is Ridley's Balance Sheet Risky?
As Ridley has a meaningful amount of debt, we need to check its balance sheet to see if the company might have debt risks. A quick check of its financial situation can be done with two ratios: net debt divided by EBITDA (earnings before interest, tax, depreciation and amortisation), and net interest cover. Net debt to EBITDA is a measure of a company's total debt. Net interest cover measures the ability to meet interest payments. Essentially we check that a) the company does not have too much debt, and b) that it can afford to pay the interest. With net debt of 3.04 times its EBITDA, investors are starting to take on a meaningful amount of risk, should the business enter a downturn.
Net interest cover can be calculated by dividing earnings before interest and tax (EBIT) by the company's net interest expense. With EBIT of 4.86 times its interest expense, Ridley's interest cover is starting to look a bit thin.
We update our data on Ridley every 24 hours, so you can always get our latest analysis of its financial health, here.
Dividend Volatility
One of the major risks of relying on dividend income, is the potential for a company to struggle financially and cut its dividend. Not only is your income cut, but the value of your investment declines as well - nasty. Ridley has been paying dividends for a long time, but for the purpose of this analysis, we only examine the past 10 years of payments. Its dividend payments have declined on at least one occasion over the past ten years. During the past ten-year period, the first annual payment was AU$0.07 in 2010, compared to AU$0.043 last year. The dividend has shrunk at around 4.9% a year during that period. Ridley's dividend has been cut sharply at least once, so it hasn't fallen by 4.9% every year, but this is a decent approximation of the long term change.
When a company's per-share dividend falls we question if this reflects poorly on either external business conditions, or the company's capital allocation decisions. Either way, we find it hard to get excited about a company with a declining dividend.
Dividend Growth Potential
With a relatively unstable dividend, it's even more important to evaluate if earnings per share (EPS) are growing - it's not worth taking the risk on a dividend getting cut, unless you might be rewarded with larger dividends in future. Earnings have grown at around 6.0% a year for the past five years, which is better than seeing them shrink! Earnings per share are growing at an acceptable rate, although the company is paying out more than half of its profits, which we think could constrain its ability to reinvest in its business.
Conclusion
Dividend investors should always want to know if a) a company's dividends are affordable, b) if there is a track record of consistent payments, and c) if the dividend is capable of growing. First, we think Ridley has an acceptable payout ratio, although its dividend was not well covered by cashflow. Unfortunately, earnings growth has also been mediocre, and the company has cut its dividend at least once in the past. With this information in mind, we think Ridley may not be an ideal dividend stock.
Earnings growth generally bodes well for the future value of company dividend payments. See if the 3 Ridley analysts we track are forecasting continued growth with our free report on analyst estimates for the company.
Looking for more high-yielding dividend ideas? Try our curated list of dividend stocks with a yield above 3%.
If you spot an error that warrants correction, please contact the editor at editorial-team@simplywallst.com. This article by Simply Wall St is general in nature. It does not constitute a recommendation to buy or sell any stock, and does not take account of your objectives, or your financial situation. Simply Wall St has no position in the stocks mentioned.
We aim to bring you long-term focused research analysis driven by fundamental data. Note that our analysis may not factor in the latest price-sensitive company announcements or qualitative material. Thank you for reading.
