
 Yahoo Finance
 RGC Resources, Inc. (NASDAQ:RGCO) Delivered A Better ROE Than Its Industry

While some investors are already well versed in financial metrics (hat tip), this article is for those who would like to learn about Return On Equity (ROE) and why it is important. To keep the lesson grounded in practicality, we'll use ROE to better understand RGC Resources, Inc. (NASDAQ:RGCO).
Return on equity or ROE is an important factor to be considered by a shareholder because it tells them how effectively their capital is being reinvested. Simply put, it is used to assess the profitability of a company in relation to its equity capital.
View our latest analysis for RGC Resources
How Do You Calculate Return On Equity?
Return on equity can be calculated by using the formula:
Return on Equity = Net Profit (from continuing operations) ÷ Shareholders' Equity
So, based on the above formula, the ROE for RGC Resources is:
13% = US$11m ÷ US$90m (Based on the trailing twelve months to June 2020).
The 'return' is the amount earned after tax over the last twelve months. That means that for every $1 worth of shareholders' equity, the company generated $0.13 in profit.
Does RGC Resources Have A Good Return On Equity?
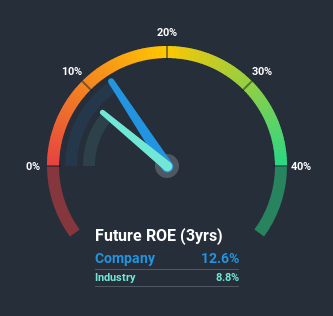
By comparing a company's ROE with its industry average, we can get a quick measure of how good it is. Importantly, this is far from a perfect measure, because companies differ significantly within the same industry classification. As is clear from the image below, RGC Resources has a better ROE than the average (8.8%) in the Gas Utilities industry.
That is a good sign. Bear in mind, a high ROE doesn't always mean superior financial performance. A higher proportion of debt in a company's capital structure may also result in a high ROE, where the high debt levels could be a huge risk .
Why You Should Consider Debt When Looking At ROE
Most companies need money -- from somewhere -- to grow their profits. That cash can come from retained earnings, issuing new shares (equity), or debt. In the first two cases, the ROE will capture this use of capital to grow. In the latter case, the use of debt will improve the returns, but will not change the equity. In this manner the use of debt will boost ROE, even though the core economics of the business stay the same.
Combining RGC Resources' Debt And Its 13% Return On Equity
It's worth noting the high use of debt by RGC Resources, leading to its debt to equity ratio of 1.32. There's no doubt its ROE is decent, but the very high debt the company carries is not too exciting to see. Debt does bring extra risk, so it's only really worthwhile when a company generates some decent returns from it.
Conclusion
Return on equity is useful for comparing the quality of different businesses. A company that can achieve a high return on equity without debt could be considered a high quality business. All else being equal, a higher ROE is better.
But when a business is high quality, the market often bids it up to a price that reflects this. The rate at which profits are likely to grow, relative to the expectations of profit growth reflected in the current price, must be considered, too. So I think it may be worth checking this free report on analyst forecasts for the company.
Of course, you might find a fantastic investment by looking elsewhere. So take a peek at this free list of interesting companies.
This article by Simply Wall St is general in nature. It does not constitute a recommendation to buy or sell any stock, and does not take account of your objectives, or your financial situation. We aim to bring you long-term focused analysis driven by fundamental data. Note that our analysis may not factor in the latest price-sensitive company announcements or qualitative material. Simply Wall St has no position in any stocks mentioned.
Have feedback on this article? Concerned about the content? Get in touch with us directly. Alternatively, email editorial-team@simplywallst.com.
