
 Yahoo Finance
 Returns At TC Energy (TSE:TRP) Appear To Be Weighed Down
To find a multi-bagger stock, what are the underlying trends we should look for in a business? Ideally, a business will show two trends; firstly a growing return on capital employed (ROCE) and secondly, an increasing amount of capital employed. This shows us that it's a compounding machine, able to continually reinvest its earnings back into the business and generate higher returns. However, after briefly looking over the numbers, we don't think TC Energy (TSE:TRP) has the makings of a multi-bagger going forward, but let's have a look at why that may be.
Understanding Return On Capital Employed (ROCE)
For those that aren't sure what ROCE is, it measures the amount of pre-tax profits a company can generate from the capital employed in its business. To calculate this metric for TC Energy, this is the formula:
Return on Capital Employed = Earnings Before Interest and Tax (EBIT) ÷ (Total Assets - Current Liabilities)
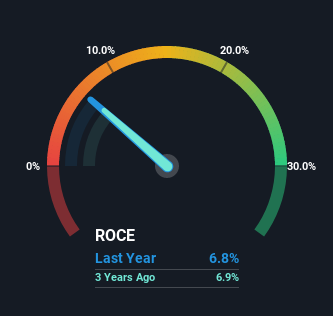
0.068 = CA$6.2b ÷ (CA$105b - CA$14b) (Based on the trailing twelve months to March 2022).
Therefore, TC Energy has an ROCE of 6.8%. In absolute terms, that's a low return and it also under-performs the Oil and Gas industry average of 12%.
View our latest analysis for TC Energy
Above you can see how the current ROCE for TC Energy compares to its prior returns on capital, but there's only so much you can tell from the past. If you'd like to see what analysts are forecasting going forward, you should check out our free report for TC Energy.
How Are Returns Trending?
Over the past five years, TC Energy's ROCE and capital employed have both remained mostly flat. Businesses with these traits tend to be mature and steady operations because they're past the growth phase. So unless we see a substantial change at TC Energy in terms of ROCE and additional investments being made, we wouldn't hold our breath on it being a multi-bagger. That being the case, it makes sense that TC Energy has been paying out 82% of its earnings to its shareholders. If the company is in fact lacking growth opportunities, that's one of the viable alternatives for the money.
The Bottom Line On TC Energy's ROCE
In summary, TC Energy isn't compounding its earnings but is generating stable returns on the same amount of capital employed. Since the stock has gained an impressive 48% over the last five years, investors must think there's better things to come. But if the trajectory of these underlying trends continue, we think the likelihood of it being a multi-bagger from here isn't high.
TC Energy does have some risks, we noticed 3 warning signs (and 2 which don't sit too well with us) we think you should know about.
If you want to search for solid companies with great earnings, check out this free list of companies with good balance sheets and impressive returns on equity.
Have feedback on this article? Concerned about the content? Get in touch with us directly. Alternatively, email editorial-team (at) simplywallst.com.
This article by Simply Wall St is general in nature. We provide commentary based on historical data and analyst forecasts only using an unbiased methodology and our articles are not intended to be financial advice. It does not constitute a recommendation to buy or sell any stock, and does not take account of your objectives, or your financial situation. We aim to bring you long-term focused analysis driven by fundamental data. Note that our analysis may not factor in the latest price-sensitive company announcements or qualitative material. Simply Wall St has no position in any stocks mentioned.
