
 Yahoo Finance
 The Returns At Gale Pacific (ASX:GAP) Aren't Growing
If you're not sure where to start when looking for the next multi-bagger, there are a few key trends you should keep an eye out for. Firstly, we'll want to see a proven return on capital employed (ROCE) that is increasing, and secondly, an expanding base of capital employed. This shows us that it's a compounding machine, able to continually reinvest its earnings back into the business and generate higher returns. Although, when we looked at Gale Pacific (ASX:GAP), it didn't seem to tick all of these boxes.
Understanding Return On Capital Employed (ROCE)
Just to clarify if you're unsure, ROCE is a metric for evaluating how much pre-tax income (in percentage terms) a company earns on the capital invested in its business. The formula for this calculation on Gale Pacific is:
Return on Capital Employed = Earnings Before Interest and Tax (EBIT) ÷ (Total Assets - Current Liabilities)
0.084 = AU$11m ÷ (AU$194m - AU$65m) (Based on the trailing twelve months to December 2021).
Therefore, Gale Pacific has an ROCE of 8.4%. In absolute terms, that's a low return and it also under-performs the Consumer Durables industry average of 14%.
Check out our latest analysis for Gale Pacific
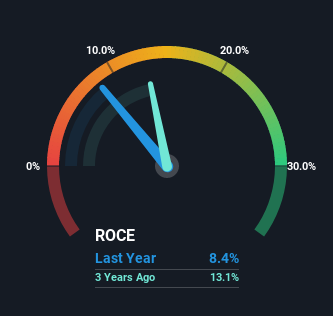
Historical performance is a great place to start when researching a stock so above you can see the gauge for Gale Pacific's ROCE against it's prior returns. If you're interested in investigating Gale Pacific's past further, check out this free graph of past earnings, revenue and cash flow.
What Can We Tell From Gale Pacific's ROCE Trend?
Over the past five years, Gale Pacific's ROCE and capital employed have both remained mostly flat. This tells us the company isn't reinvesting in itself, so it's plausible that it's past the growth phase. So unless we see a substantial change at Gale Pacific in terms of ROCE and additional investments being made, we wouldn't hold our breath on it being a multi-bagger.
The Bottom Line On Gale Pacific's ROCE
In a nutshell, Gale Pacific has been trudging along with the same returns from the same amount of capital over the last five years. And with the stock having returned a mere 15% in the last five years to shareholders, you could argue that they're aware of these lackluster trends. Therefore, if you're looking for a multi-bagger, we'd propose looking at other options.
Gale Pacific does have some risks, we noticed 3 warning signs (and 1 which is potentially serious) we think you should know about.
If you want to search for solid companies with great earnings, check out this free list of companies with good balance sheets and impressive returns on equity.
Have feedback on this article? Concerned about the content? Get in touch with us directly. Alternatively, email editorial-team (at) simplywallst.com.
This article by Simply Wall St is general in nature. We provide commentary based on historical data and analyst forecasts only using an unbiased methodology and our articles are not intended to be financial advice. It does not constitute a recommendation to buy or sell any stock, and does not take account of your objectives, or your financial situation. We aim to bring you long-term focused analysis driven by fundamental data. Note that our analysis may not factor in the latest price-sensitive company announcements or qualitative material. Simply Wall St has no position in any stocks mentioned.
