
 Yahoo Finance
 Returns Are Gaining Momentum At Wheaton Precious Metals (TSE:WPM)
What are the early trends we should look for to identify a stock that could multiply in value over the long term? Firstly, we'd want to identify a growing return on capital employed (ROCE) and then alongside that, an ever-increasing base of capital employed. Put simply, these types of businesses are compounding machines, meaning they are continually reinvesting their earnings at ever-higher rates of return. With that in mind, we've noticed some promising trends at Wheaton Precious Metals (TSE:WPM) so let's look a bit deeper.
Understanding Return On Capital Employed (ROCE)
For those that aren't sure what ROCE is, it measures the amount of pre-tax profits a company can generate from the capital employed in its business. The formula for this calculation on Wheaton Precious Metals is:
Return on Capital Employed = Earnings Before Interest and Tax (EBIT) ÷ (Total Assets - Current Liabilities)
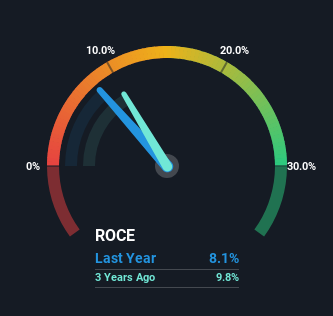
0.081 = US$572m ÷ (US$7.2b - US$88m) (Based on the trailing twelve months to March 2024).
Thus, Wheaton Precious Metals has an ROCE of 8.1%. On its own that's a low return, but compared to the average of 1.5% generated by the Metals and Mining industry, it's much better.
View our latest analysis for Wheaton Precious Metals
In the above chart we have measured Wheaton Precious Metals' prior ROCE against its prior performance, but the future is arguably more important. If you'd like to see what analysts are forecasting going forward, you should check out our free analyst report for Wheaton Precious Metals .
The Trend Of ROCE
Wheaton Precious Metals has not disappointed with their ROCE growth. Looking at the data, we can see that even though capital employed in the business has remained relatively flat, the ROCE generated has risen by 117% over the last five years. So it's likely that the business is now reaping the full benefits of its past investments, since the capital employed hasn't changed considerably. On that front, things are looking good so it's worth exploring what management has said about growth plans going forward.
In Conclusion...
To sum it up, Wheaton Precious Metals is collecting higher returns from the same amount of capital, and that's impressive. Since the stock has returned a staggering 154% to shareholders over the last five years, it looks like investors are recognizing these changes. In light of that, we think it's worth looking further into this stock because if Wheaton Precious Metals can keep these trends up, it could have a bright future ahead.
Before jumping to any conclusions though, we need to know what value we're getting for the current share price. That's where you can check out our FREE intrinsic value estimation for WPM that compares the share price and estimated value.
For those who like to invest in solid companies, check out this free list of companies with solid balance sheets and high returns on equity.
Have feedback on this article? Concerned about the content? Get in touch with us directly. Alternatively, email editorial-team (at) simplywallst.com.
This article by Simply Wall St is general in nature. We provide commentary based on historical data and analyst forecasts only using an unbiased methodology and our articles are not intended to be financial advice. It does not constitute a recommendation to buy or sell any stock, and does not take account of your objectives, or your financial situation. We aim to bring you long-term focused analysis driven by fundamental data. Note that our analysis may not factor in the latest price-sensitive company announcements or qualitative material. Simply Wall St has no position in any stocks mentioned.
