
 Yahoo Finance
 Returns Are Gaining Momentum At Transat A.T (TSE:TRZ)
Finding a business that has the potential to grow substantially is not easy, but it is possible if we look at a few key financial metrics. Firstly, we'll want to see a proven return on capital employed (ROCE) that is increasing, and secondly, an expanding base of capital employed. Ultimately, this demonstrates that it's a business that is reinvesting profits at increasing rates of return. With that in mind, we've noticed some promising trends at Transat A.T (TSE:TRZ) so let's look a bit deeper.
Understanding Return On Capital Employed (ROCE)
If you haven't worked with ROCE before, it measures the 'return' (pre-tax profit) a company generates from capital employed in its business. Analysts use this formula to calculate it for Transat A.T:
Return on Capital Employed = Earnings Before Interest and Tax (EBIT) ÷ (Total Assets - Current Liabilities)
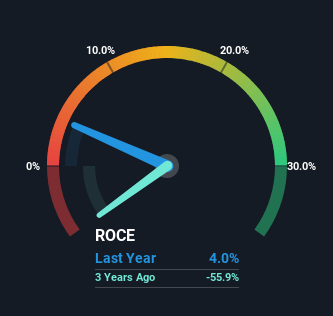
0.04 = CA$46m ÷ (CA$2.8b - CA$1.6b) (Based on the trailing twelve months to January 2024).
Thus, Transat A.T has an ROCE of 4.0%. Ultimately, that's a low return and it under-performs the Airlines industry average of 8.6%.
Check out our latest analysis for Transat A.T
Above you can see how the current ROCE for Transat A.T compares to its prior returns on capital, but there's only so much you can tell from the past. If you'd like to see what analysts are forecasting going forward, you should check out our free analyst report for Transat A.T .
So How Is Transat A.T's ROCE Trending?
Transat A.T has recently broken into profitability so their prior investments seem to be paying off. The company was generating losses five years ago, but now it's earning 4.0% which is a sight for sore eyes. Not only that, but the company is utilizing 79% more capital than before, but that's to be expected from a company trying to break into profitability. We like this trend, because it tells us the company has profitable reinvestment opportunities available to it, and if it continues going forward that can lead to a multi-bagger performance.
On a separate but related note, it's important to know that Transat A.T has a current liabilities to total assets ratio of 59%, which we'd consider pretty high. This can bring about some risks because the company is basically operating with a rather large reliance on its suppliers or other sorts of short-term creditors. Ideally we'd like to see this reduce as that would mean fewer obligations bearing risks.
Our Take On Transat A.T's ROCE
To the delight of most shareholders, Transat A.T has now broken into profitability. However the stock is down a substantial 77% in the last five years so there could be other areas of the business hurting its prospects. In any case, we believe the economic trends of this company are positive and looking into the stock further could prove rewarding.
One final note, you should learn about the 4 warning signs we've spotted with Transat A.T (including 2 which can't be ignored) .
While Transat A.T isn't earning the highest return, check out this free list of companies that are earning high returns on equity with solid balance sheets.
Have feedback on this article? Concerned about the content? Get in touch with us directly. Alternatively, email editorial-team (at) simplywallst.com.
This article by Simply Wall St is general in nature. We provide commentary based on historical data and analyst forecasts only using an unbiased methodology and our articles are not intended to be financial advice. It does not constitute a recommendation to buy or sell any stock, and does not take account of your objectives, or your financial situation. We aim to bring you long-term focused analysis driven by fundamental data. Note that our analysis may not factor in the latest price-sensitive company announcements or qualitative material. Simply Wall St has no position in any stocks mentioned.
