
 Yahoo Finance
 Returns Are Gaining Momentum At Decmil Group (ASX:DCG)
If we want to find a potential multi-bagger, often there are underlying trends that can provide clues. Typically, we'll want to notice a trend of growing return on capital employed (ROCE) and alongside that, an expanding base of capital employed. Basically this means that a company has profitable initiatives that it can continue to reinvest in, which is a trait of a compounding machine. Speaking of which, we noticed some great changes in Decmil Group's (ASX:DCG) returns on capital, so let's have a look.
What Is Return On Capital Employed (ROCE)?
Just to clarify if you're unsure, ROCE is a metric for evaluating how much pre-tax income (in percentage terms) a company earns on the capital invested in its business. Analysts use this formula to calculate it for Decmil Group:
Return on Capital Employed = Earnings Before Interest and Tax (EBIT) ÷ (Total Assets - Current Liabilities)
0.036 = AU$3.4m ÷ (AU$209m - AU$115m) (Based on the trailing twelve months to June 2023).
So, Decmil Group has an ROCE of 3.6%. In absolute terms, that's a low return and it also under-performs the Construction industry average of 15%.
See our latest analysis for Decmil Group
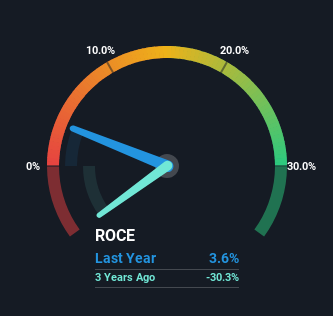
Historical performance is a great place to start when researching a stock so above you can see the gauge for Decmil Group's ROCE against it's prior returns. If you want to delve into the historical earnings, revenue and cash flow of Decmil Group, check out these free graphs here.
So How Is Decmil Group's ROCE Trending?
It's nice to see that ROCE is headed in the right direction, even if it is still relatively low. The figures show that over the last five years, returns on capital have grown by 315%. The company is now earning AU$0.04 per dollar of capital employed. Speaking of capital employed, the company is actually utilizing 55% less than it was five years ago, which can be indicative of a business that's improving its efficiency. If this trend continues, the business might be getting more efficient but it's shrinking in terms of total assets.
On a side note, we noticed that the improvement in ROCE appears to be partly fueled by an increase in current liabilities. Essentially the business now has suppliers or short-term creditors funding about 55% of its operations, which isn't ideal. Given it's pretty high ratio, we'd remind investors that having current liabilities at those levels can bring about some risks in certain businesses.
The Bottom Line
In the end, Decmil Group has proven it's capital allocation skills are good with those higher returns from less amount of capital. And since the stock has dived 98% over the last five years, there may be other factors affecting the company's prospects. Regardless, we think the underlying fundamentals warrant this stock for further investigation.
If you'd like to know more about Decmil Group, we've spotted 3 warning signs, and 2 of them don't sit too well with us.
If you want to search for solid companies with great earnings, check out this free list of companies with good balance sheets and impressive returns on equity.
Have feedback on this article? Concerned about the content? Get in touch with us directly. Alternatively, email editorial-team (at) simplywallst.com.
This article by Simply Wall St is general in nature. We provide commentary based on historical data and analyst forecasts only using an unbiased methodology and our articles are not intended to be financial advice. It does not constitute a recommendation to buy or sell any stock, and does not take account of your objectives, or your financial situation. We aim to bring you long-term focused analysis driven by fundamental data. Note that our analysis may not factor in the latest price-sensitive company announcements or qualitative material. Simply Wall St has no position in any stocks mentioned.
