
 Yahoo Finance
 Returns On Capital Signal Tricky Times Ahead For Aquirian (ASX:AQN)
Finding a business that has the potential to grow substantially is not easy, but it is possible if we look at a few key financial metrics. Amongst other things, we'll want to see two things; firstly, a growing return on capital employed (ROCE) and secondly, an expansion in the company's amount of capital employed. Ultimately, this demonstrates that it's a business that is reinvesting profits at increasing rates of return. However, after investigating Aquirian (ASX:AQN), we don't think it's current trends fit the mold of a multi-bagger.
Return On Capital Employed (ROCE): What Is It?
Just to clarify if you're unsure, ROCE is a metric for evaluating how much pre-tax income (in percentage terms) a company earns on the capital invested in its business. To calculate this metric for Aquirian, this is the formula:
Return on Capital Employed = Earnings Before Interest and Tax (EBIT) ÷ (Total Assets - Current Liabilities)
0.045 = AU$880k ÷ (AU$26m - AU$6.1m) (Based on the trailing twelve months to June 2023).
Thus, Aquirian has an ROCE of 4.5%. In absolute terms, that's a low return and it also under-performs the Professional Services industry average of 15%.
Check out our latest analysis for Aquirian
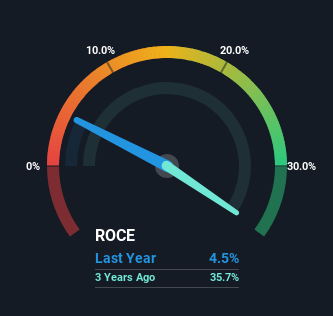
Historical performance is a great place to start when researching a stock so above you can see the gauge for Aquirian's ROCE against it's prior returns. If you'd like to look at how Aquirian has performed in the past in other metrics, you can view this free graph of past earnings, revenue and cash flow.
What Can We Tell From Aquirian's ROCE Trend?
When we looked at the ROCE trend at Aquirian, we didn't gain much confidence. Over the last three years, returns on capital have decreased to 4.5% from 36% three years ago. Although, given both revenue and the amount of assets employed in the business have increased, it could suggest the company is investing in growth, and the extra capital has led to a short-term reduction in ROCE. And if the increased capital generates additional returns, the business, and thus shareholders, will benefit in the long run.
On a side note, Aquirian has done well to pay down its current liabilities to 24% of total assets. So we could link some of this to the decrease in ROCE. Effectively this means their suppliers or short-term creditors are funding less of the business, which reduces some elements of risk. Since the business is basically funding more of its operations with it's own money, you could argue this has made the business less efficient at generating ROCE.
Our Take On Aquirian's ROCE
In summary, despite lower returns in the short term, we're encouraged to see that Aquirian is reinvesting for growth and has higher sales as a result. And there could be an opportunity here if other metrics look good too, because the stock has declined 45% in the last year. So we think it'd be worthwhile to look further into this stock given the trends look encouraging.
If you'd like to know more about Aquirian, we've spotted 4 warning signs, and 3 of them are potentially serious.
If you want to search for solid companies with great earnings, check out this free list of companies with good balance sheets and impressive returns on equity.
Have feedback on this article? Concerned about the content? Get in touch with us directly. Alternatively, email editorial-team (at) simplywallst.com.
This article by Simply Wall St is general in nature. We provide commentary based on historical data and analyst forecasts only using an unbiased methodology and our articles are not intended to be financial advice. It does not constitute a recommendation to buy or sell any stock, and does not take account of your objectives, or your financial situation. We aim to bring you long-term focused analysis driven by fundamental data. Note that our analysis may not factor in the latest price-sensitive company announcements or qualitative material. Simply Wall St has no position in any stocks mentioned.
