
 Yahoo Finance
 Returns On Capital Signal Tricky Times Ahead For Brüder Mannesmann (FRA:BMM)
If you're looking for a multi-bagger, there's a few things to keep an eye out for. Firstly, we'd want to identify a growing return on capital employed (ROCE) and then alongside that, an ever-increasing base of capital employed. Ultimately, this demonstrates that it's a business that is reinvesting profits at increasing rates of return. Although, when we looked at Brüder Mannesmann (FRA:BMM), it didn't seem to tick all of these boxes.
Understanding Return On Capital Employed (ROCE)
For those that aren't sure what ROCE is, it measures the amount of pre-tax profits a company can generate from the capital employed in its business. The formula for this calculation on Brüder Mannesmann is:
Return on Capital Employed = Earnings Before Interest and Tax (EBIT) ÷ (Total Assets - Current Liabilities)
0.0065 = €206k ÷ (€41m - €9.6m) (Based on the trailing twelve months to December 2022).
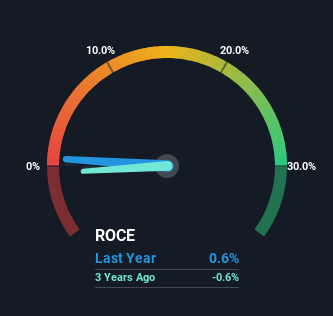
Therefore, Brüder Mannesmann has an ROCE of 0.6%. Ultimately, that's a low return and it under-performs the Retail Distributors industry average of 14%.
View our latest analysis for Brüder Mannesmann
While the past is not representative of the future, it can be helpful to know how a company has performed historically, which is why we have this chart above. If you're interested in investigating Brüder Mannesmann's past further, check out this free graph covering Brüder Mannesmann's past earnings, revenue and cash flow.
What Can We Tell From Brüder Mannesmann's ROCE Trend?
When we looked at the ROCE trend at Brüder Mannesmann, we didn't gain much confidence. Around five years ago the returns on capital were 8.0%, but since then they've fallen to 0.6%. Given the business is employing more capital while revenue has slipped, this is a bit concerning. If this were to continue, you might be looking at a company that is trying to reinvest for growth but is actually losing market share since sales haven't increased.
On a side note, Brüder Mannesmann has done well to pay down its current liabilities to 23% of total assets. So we could link some of this to the decrease in ROCE. Effectively this means their suppliers or short-term creditors are funding less of the business, which reduces some elements of risk. Some would claim this reduces the business' efficiency at generating ROCE since it is now funding more of the operations with its own money.
The Bottom Line
From the above analysis, we find it rather worrisome that returns on capital and sales for Brüder Mannesmann have fallen, meanwhile the business is employing more capital than it was five years ago. However the stock has delivered a 41% return to shareholders over the last five years, so investors might be expecting the trends to turn around. In any case, the current underlying trends don't bode well for long term performance so unless they reverse, we'd start looking elsewhere.
One more thing: We've identified 7 warning signs with Brüder Mannesmann (at least 4 which can't be ignored) , and understanding them would certainly be useful.
For those who like to invest in solid companies, check out this free list of companies with solid balance sheets and high returns on equity.
Have feedback on this article? Concerned about the content? Get in touch with us directly. Alternatively, email editorial-team (at) simplywallst.com.
This article by Simply Wall St is general in nature. We provide commentary based on historical data and analyst forecasts only using an unbiased methodology and our articles are not intended to be financial advice. It does not constitute a recommendation to buy or sell any stock, and does not take account of your objectives, or your financial situation. We aim to bring you long-term focused analysis driven by fundamental data. Note that our analysis may not factor in the latest price-sensitive company announcements or qualitative material. Simply Wall St has no position in any stocks mentioned.
