
 Yahoo Finance
 Returns On Capital Signal Tricky Times Ahead For Soup Holdings (SGX:5KI)
If you're looking for a multi-bagger, there's a few things to keep an eye out for. Firstly, we'd want to identify a growing return on capital employed (ROCE) and then alongside that, an ever-increasing base of capital employed. Basically this means that a company has profitable initiatives that it can continue to reinvest in, which is a trait of a compounding machine. However, after investigating Soup Holdings (SGX:5KI), we don't think it's current trends fit the mold of a multi-bagger.
What Is Return On Capital Employed (ROCE)?
For those who don't know, ROCE is a measure of a company's yearly pre-tax profit (its return), relative to the capital employed in the business. The formula for this calculation on Soup Holdings is:
Return on Capital Employed = Earnings Before Interest and Tax (EBIT) ÷ (Total Assets - Current Liabilities)
0.087 = S$1.7m ÷ (S$32m - S$13m) (Based on the trailing twelve months to December 2023).
Thus, Soup Holdings has an ROCE of 8.7%. On its own that's a low return, but compared to the average of 4.5% generated by the Hospitality industry, it's much better.
See our latest analysis for Soup Holdings
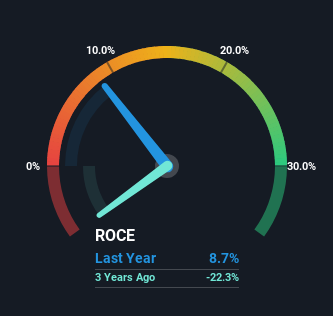
Historical performance is a great place to start when researching a stock so above you can see the gauge for Soup Holdings' ROCE against it's prior returns. If you'd like to look at how Soup Holdings has performed in the past in other metrics, you can view this free graph of Soup Holdings' past earnings, revenue and cash flow.
What Can We Tell From Soup Holdings' ROCE Trend?
In terms of Soup Holdings' historical ROCE movements, the trend isn't fantastic. Around five years ago the returns on capital were 23%, but since then they've fallen to 8.7%. On the other hand, the company has been employing more capital without a corresponding improvement in sales in the last year, which could suggest these investments are longer term plays. It may take some time before the company starts to see any change in earnings from these investments.
What We Can Learn From Soup Holdings' ROCE
Bringing it all together, while we're somewhat encouraged by Soup Holdings' reinvestment in its own business, we're aware that returns are shrinking. And investors appear hesitant that the trends will pick up because the stock has fallen 47% in the last five years. In any case, the stock doesn't have these traits of a multi-bagger discussed above, so if that's what you're looking for, we think you'd have more luck elsewhere.
If you want to know some of the risks facing Soup Holdings we've found 4 warning signs (1 is significant!) that you should be aware of before investing here.
While Soup Holdings may not currently earn the highest returns, we've compiled a list of companies that currently earn more than 25% return on equity. Check out this free list here.
Have feedback on this article? Concerned about the content? Get in touch with us directly. Alternatively, email editorial-team (at) simplywallst.com.
This article by Simply Wall St is general in nature. We provide commentary based on historical data and analyst forecasts only using an unbiased methodology and our articles are not intended to be financial advice. It does not constitute a recommendation to buy or sell any stock, and does not take account of your objectives, or your financial situation. We aim to bring you long-term focused analysis driven by fundamental data. Note that our analysis may not factor in the latest price-sensitive company announcements or qualitative material. Simply Wall St has no position in any stocks mentioned.
Have feedback on this article? Concerned about the content? Get in touch with us directly. Alternatively, email editorial-team@simplywallst.com
