
 Yahoo Finance
 Returns On Capital Are Showing Encouraging Signs At Image Resources (ASX:IMA)
To find a multi-bagger stock, what are the underlying trends we should look for in a business? In a perfect world, we'd like to see a company investing more capital into its business and ideally the returns earned from that capital are also increasing. This shows us that it's a compounding machine, able to continually reinvest its earnings back into the business and generate higher returns. Speaking of which, we noticed some great changes in Image Resources' (ASX:IMA) returns on capital, so let's have a look.
What Is Return On Capital Employed (ROCE)?
For those that aren't sure what ROCE is, it measures the amount of pre-tax profits a company can generate from the capital employed in its business. To calculate this metric for Image Resources, this is the formula:
Return on Capital Employed = Earnings Before Interest and Tax (EBIT) ÷ (Total Assets - Current Liabilities)
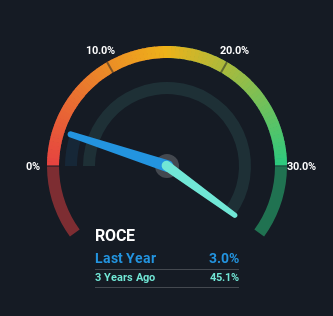
0.03 = AU$4.4m ÷ (AU$200m - AU$54m) (Based on the trailing twelve months to June 2023).
So, Image Resources has an ROCE of 3.0%. In absolute terms, that's a low return and it also under-performs the Metals and Mining industry average of 9.1%.
See our latest analysis for Image Resources
While the past is not representative of the future, it can be helpful to know how a company has performed historically, which is why we have this chart above. If you want to delve into the historical earnings, revenue and cash flow of Image Resources, check out these free graphs here.
So How Is Image Resources' ROCE Trending?
The fact that Image Resources is now generating some pre-tax profits from its prior investments is very encouraging. Shareholders would no doubt be pleased with this because the business was loss-making five years ago but is is now generating 3.0% on its capital. Not only that, but the company is utilizing 42% more capital than before, but that's to be expected from a company trying to break into profitability. We like this trend, because it tells us the company has profitable reinvestment opportunities available to it, and if it continues going forward that can lead to a multi-bagger performance.
On a side note, we noticed that the improvement in ROCE appears to be partly fueled by an increase in current liabilities. The current liabilities has increased to 27% of total assets, so the business is now more funded by the likes of its suppliers or short-term creditors. Keep an eye out for future increases because when the ratio of current liabilities to total assets gets particularly high, this can introduce some new risks for the business.
The Bottom Line On Image Resources' ROCE
Overall, Image Resources gets a big tick from us thanks in most part to the fact that it is now profitable and is reinvesting in its business. And since the stock has fallen 34% over the last five years, there might be an opportunity here. So researching this company further and determining whether or not these trends will continue seems justified.
Like most companies, Image Resources does come with some risks, and we've found 3 warning signs that you should be aware of.
While Image Resources isn't earning the highest return, check out this free list of companies that are earning high returns on equity with solid balance sheets.
Have feedback on this article? Concerned about the content? Get in touch with us directly. Alternatively, email editorial-team (at) simplywallst.com.
This article by Simply Wall St is general in nature. We provide commentary based on historical data and analyst forecasts only using an unbiased methodology and our articles are not intended to be financial advice. It does not constitute a recommendation to buy or sell any stock, and does not take account of your objectives, or your financial situation. We aim to bring you long-term focused analysis driven by fundamental data. Note that our analysis may not factor in the latest price-sensitive company announcements or qualitative material. Simply Wall St has no position in any stocks mentioned.
