
 Yahoo Finance
 Returns On Capital Are Showing Encouraging Signs At iQIYI (NASDAQ:IQ)
Did you know there are some financial metrics that can provide clues of a potential multi-bagger? Ideally, a business will show two trends; firstly a growing return on capital employed (ROCE) and secondly, an increasing amount of capital employed. Put simply, these types of businesses are compounding machines, meaning they are continually reinvesting their earnings at ever-higher rates of return. Speaking of which, we noticed some great changes in iQIYI's (NASDAQ:IQ) returns on capital, so let's have a look.
What Is Return On Capital Employed (ROCE)?
Just to clarify if you're unsure, ROCE is a metric for evaluating how much pre-tax income (in percentage terms) a company earns on the capital invested in its business. To calculate this metric for iQIYI, this is the formula:
Return on Capital Employed = Earnings Before Interest and Tax (EBIT) ÷ (Total Assets - Current Liabilities)
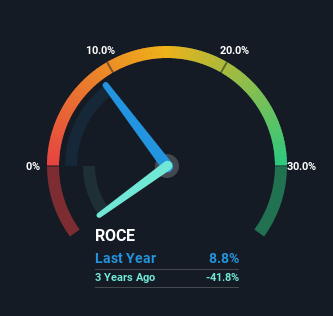
0.088 = CN¥2.1b ÷ (CN¥52b - CN¥28b) (Based on the trailing twelve months to March 2023).
Therefore, iQIYI has an ROCE of 8.8%. Ultimately, that's a low return and it under-performs the Entertainment industry average of 12%.
Check out our latest analysis for iQIYI
Above you can see how the current ROCE for iQIYI compares to its prior returns on capital, but there's only so much you can tell from the past. If you're interested, you can view the analysts predictions in our free report on analyst forecasts for the company.
The Trend Of ROCE
We're delighted to see that iQIYI is reaping rewards from its investments and is now generating some pre-tax profits. About five years ago the company was generating losses but things have turned around because it's now earning 8.8% on its capital. In addition to that, iQIYI is employing 157% more capital than previously which is expected of a company that's trying to break into profitability. We like this trend, because it tells us the company has profitable reinvestment opportunities available to it, and if it continues going forward that can lead to a multi-bagger performance.
On a separate but related note, it's important to know that iQIYI has a current liabilities to total assets ratio of 53%, which we'd consider pretty high. This effectively means that suppliers (or short-term creditors) are funding a large portion of the business, so just be aware that this can introduce some elements of risk. Ideally we'd like to see this reduce as that would mean fewer obligations bearing risks.
The Bottom Line On iQIYI's ROCE
In summary, it's great to see that iQIYI has managed to break into profitability and is continuing to reinvest in its business. Although the company may be facing some issues elsewhere since the stock has plunged 86% in the last five years. Regardless, we think the underlying fundamentals warrant this stock for further investigation.
iQIYI does come with some risks though, we found 3 warning signs in our investment analysis, and 1 of those makes us a bit uncomfortable...
For those who like to invest in solid companies, check out this free list of companies with solid balance sheets and high returns on equity.
Have feedback on this article? Concerned about the content? Get in touch with us directly. Alternatively, email editorial-team (at) simplywallst.com.
This article by Simply Wall St is general in nature. We provide commentary based on historical data and analyst forecasts only using an unbiased methodology and our articles are not intended to be financial advice. It does not constitute a recommendation to buy or sell any stock, and does not take account of your objectives, or your financial situation. We aim to bring you long-term focused analysis driven by fundamental data. Note that our analysis may not factor in the latest price-sensitive company announcements or qualitative material. Simply Wall St has no position in any stocks mentioned.
Join A Paid User Research Session
You’ll receive a US$30 Amazon Gift card for 1 hour of your time while helping us build better investing tools for the individual investors like yourself. Sign up here
