
 Yahoo Finance
 Returns On Capital Are Showing Encouraging Signs At RAVE Restaurant Group (NASDAQ:RAVE)
If you're not sure where to start when looking for the next multi-bagger, there are a few key trends you should keep an eye out for. Firstly, we'll want to see a proven return on capital employed (ROCE) that is increasing, and secondly, an expanding base of capital employed. This shows us that it's a compounding machine, able to continually reinvest its earnings back into the business and generate higher returns. With that in mind, we've noticed some promising trends at RAVE Restaurant Group (NASDAQ:RAVE) so let's look a bit deeper.
Understanding Return On Capital Employed (ROCE)
For those who don't know, ROCE is a measure of a company's yearly pre-tax profit (its return), relative to the capital employed in the business. To calculate this metric for RAVE Restaurant Group, this is the formula:
Return on Capital Employed = Earnings Before Interest and Tax (EBIT) ÷ (Total Assets - Current Liabilities)
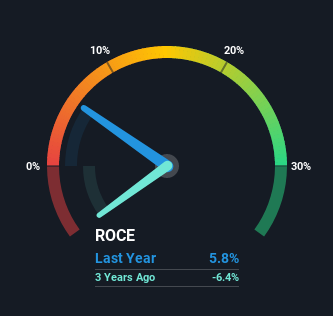
0.058 = US$598k ÷ (US$12m - US$2.2m) (Based on the trailing twelve months to March 2021).
Therefore, RAVE Restaurant Group has an ROCE of 5.8%. Ultimately, that's a low return and it under-performs the Hospitality industry average of 7.4%.
Check out our latest analysis for RAVE Restaurant Group
While the past is not representative of the future, it can be helpful to know how a company has performed historically, which is why we have this chart above. If you're interested in investigating RAVE Restaurant Group's past further, check out this free graph of past earnings, revenue and cash flow.
The Trend Of ROCE
We're delighted to see that RAVE Restaurant Group is reaping rewards from its investments and has now broken into profitability. Historically the company was generating losses but as we can see from the latest figures referenced above, they're now earning 5.8% on their capital employed. Additionally, the business is utilizing 29% less capital than it was five years ago, and taken at face value, that can mean the company needs less funds at work to get a return. The reduction could indicate that the company is selling some assets, and considering returns are up, they appear to be selling the right ones.
In Conclusion...
In summary, it's great to see that RAVE Restaurant Group has been able to turn things around and earn higher returns on lower amounts of capital. And since the stock has fallen 64% over the last five years, there might be an opportunity here. That being the case, research into the company's current valuation metrics and future prospects seems fitting.
RAVE Restaurant Group does have some risks, we noticed 5 warning signs (and 2 which make us uncomfortable) we think you should know about.
While RAVE Restaurant Group isn't earning the highest return, check out this free list of companies that are earning high returns on equity with solid balance sheets.
This article by Simply Wall St is general in nature. We provide commentary based on historical data and analyst forecasts only using an unbiased methodology and our articles are not intended to be financial advice. It does not constitute a recommendation to buy or sell any stock, and does not take account of your objectives, or your financial situation. We aim to bring you long-term focused analysis driven by fundamental data. Note that our analysis may not factor in the latest price-sensitive company announcements or qualitative material. Simply Wall St has no position in any stocks mentioned.
Have feedback on this article? Concerned about the content? Get in touch with us directly. Alternatively, email editorial-team (at) simplywallst.com.
