
 Yahoo Finance
 Returns On Capital Are Showing Encouraging Signs At RWE (ETR:RWE)
If we want to find a stock that could multiply over the long term, what are the underlying trends we should look for? Firstly, we'd want to identify a growing return on capital employed (ROCE) and then alongside that, an ever-increasing base of capital employed. If you see this, it typically means it's a company with a great business model and plenty of profitable reinvestment opportunities. So when we looked at RWE (ETR:RWE) and its trend of ROCE, we really liked what we saw.
Understanding Return On Capital Employed (ROCE)
If you haven't worked with ROCE before, it measures the 'return' (pre-tax profit) a company generates from capital employed in its business. Analysts use this formula to calculate it for RWE:
Return on Capital Employed = Earnings Before Interest and Tax (EBIT) ÷ (Total Assets - Current Liabilities)
0.085 = €6.2b ÷ (€103b - €30b) (Based on the trailing twelve months to March 2024).
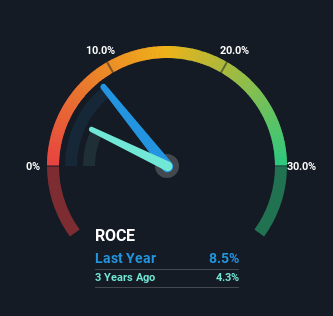
So, RWE has an ROCE of 8.5%. In absolute terms, that's a low return, but it's much better than the Renewable Energy industry average of 4.5%.
Check out our latest analysis for RWE
Above you can see how the current ROCE for RWE compares to its prior returns on capital, but there's only so much you can tell from the past. If you're interested, you can view the analysts predictions in our free analyst report for RWE .
What The Trend Of ROCE Can Tell Us
Even though ROCE is still low in absolute terms, it's good to see it's heading in the right direction. The numbers show that in the last five years, the returns generated on capital employed have grown considerably to 8.5%. Basically the business is earning more per dollar of capital invested and in addition to that, 129% more capital is being employed now too. This can indicate that there's plenty of opportunities to invest capital internally and at ever higher rates, a combination that's common among multi-baggers.
On a related note, the company's ratio of current liabilities to total assets has decreased to 29%, which basically reduces it's funding from the likes of short-term creditors or suppliers. This tells us that RWE has grown its returns without a reliance on increasing their current liabilities, which we're very happy with.
In Conclusion...
All in all, it's terrific to see that RWE is reaping the rewards from prior investments and is growing its capital base. And investors seem to expect more of this going forward, since the stock has rewarded shareholders with a 72% return over the last five years. So given the stock has proven it has promising trends, it's worth researching the company further to see if these trends are likely to persist.
One more thing: We've identified 2 warning signs with RWE (at least 1 which doesn't sit too well with us) , and understanding these would certainly be useful.
While RWE may not currently earn the highest returns, we've compiled a list of companies that currently earn more than 25% return on equity. Check out this free list here.
Have feedback on this article? Concerned about the content? Get in touch with us directly. Alternatively, email editorial-team (at) simplywallst.com.
This article by Simply Wall St is general in nature. We provide commentary based on historical data and analyst forecasts only using an unbiased methodology and our articles are not intended to be financial advice. It does not constitute a recommendation to buy or sell any stock, and does not take account of your objectives, or your financial situation. We aim to bring you long-term focused analysis driven by fundamental data. Note that our analysis may not factor in the latest price-sensitive company announcements or qualitative material. Simply Wall St has no position in any stocks mentioned.
